Copyright
©The Author(s) 2023.
World J Gastroenterol. May 14, 2023; 29(18): 2798-2817
Published online May 14, 2023. doi: 10.3748/wjg.v29.i18.2798
Published online May 14, 2023. doi: 10.3748/wjg.v29.i18.2798
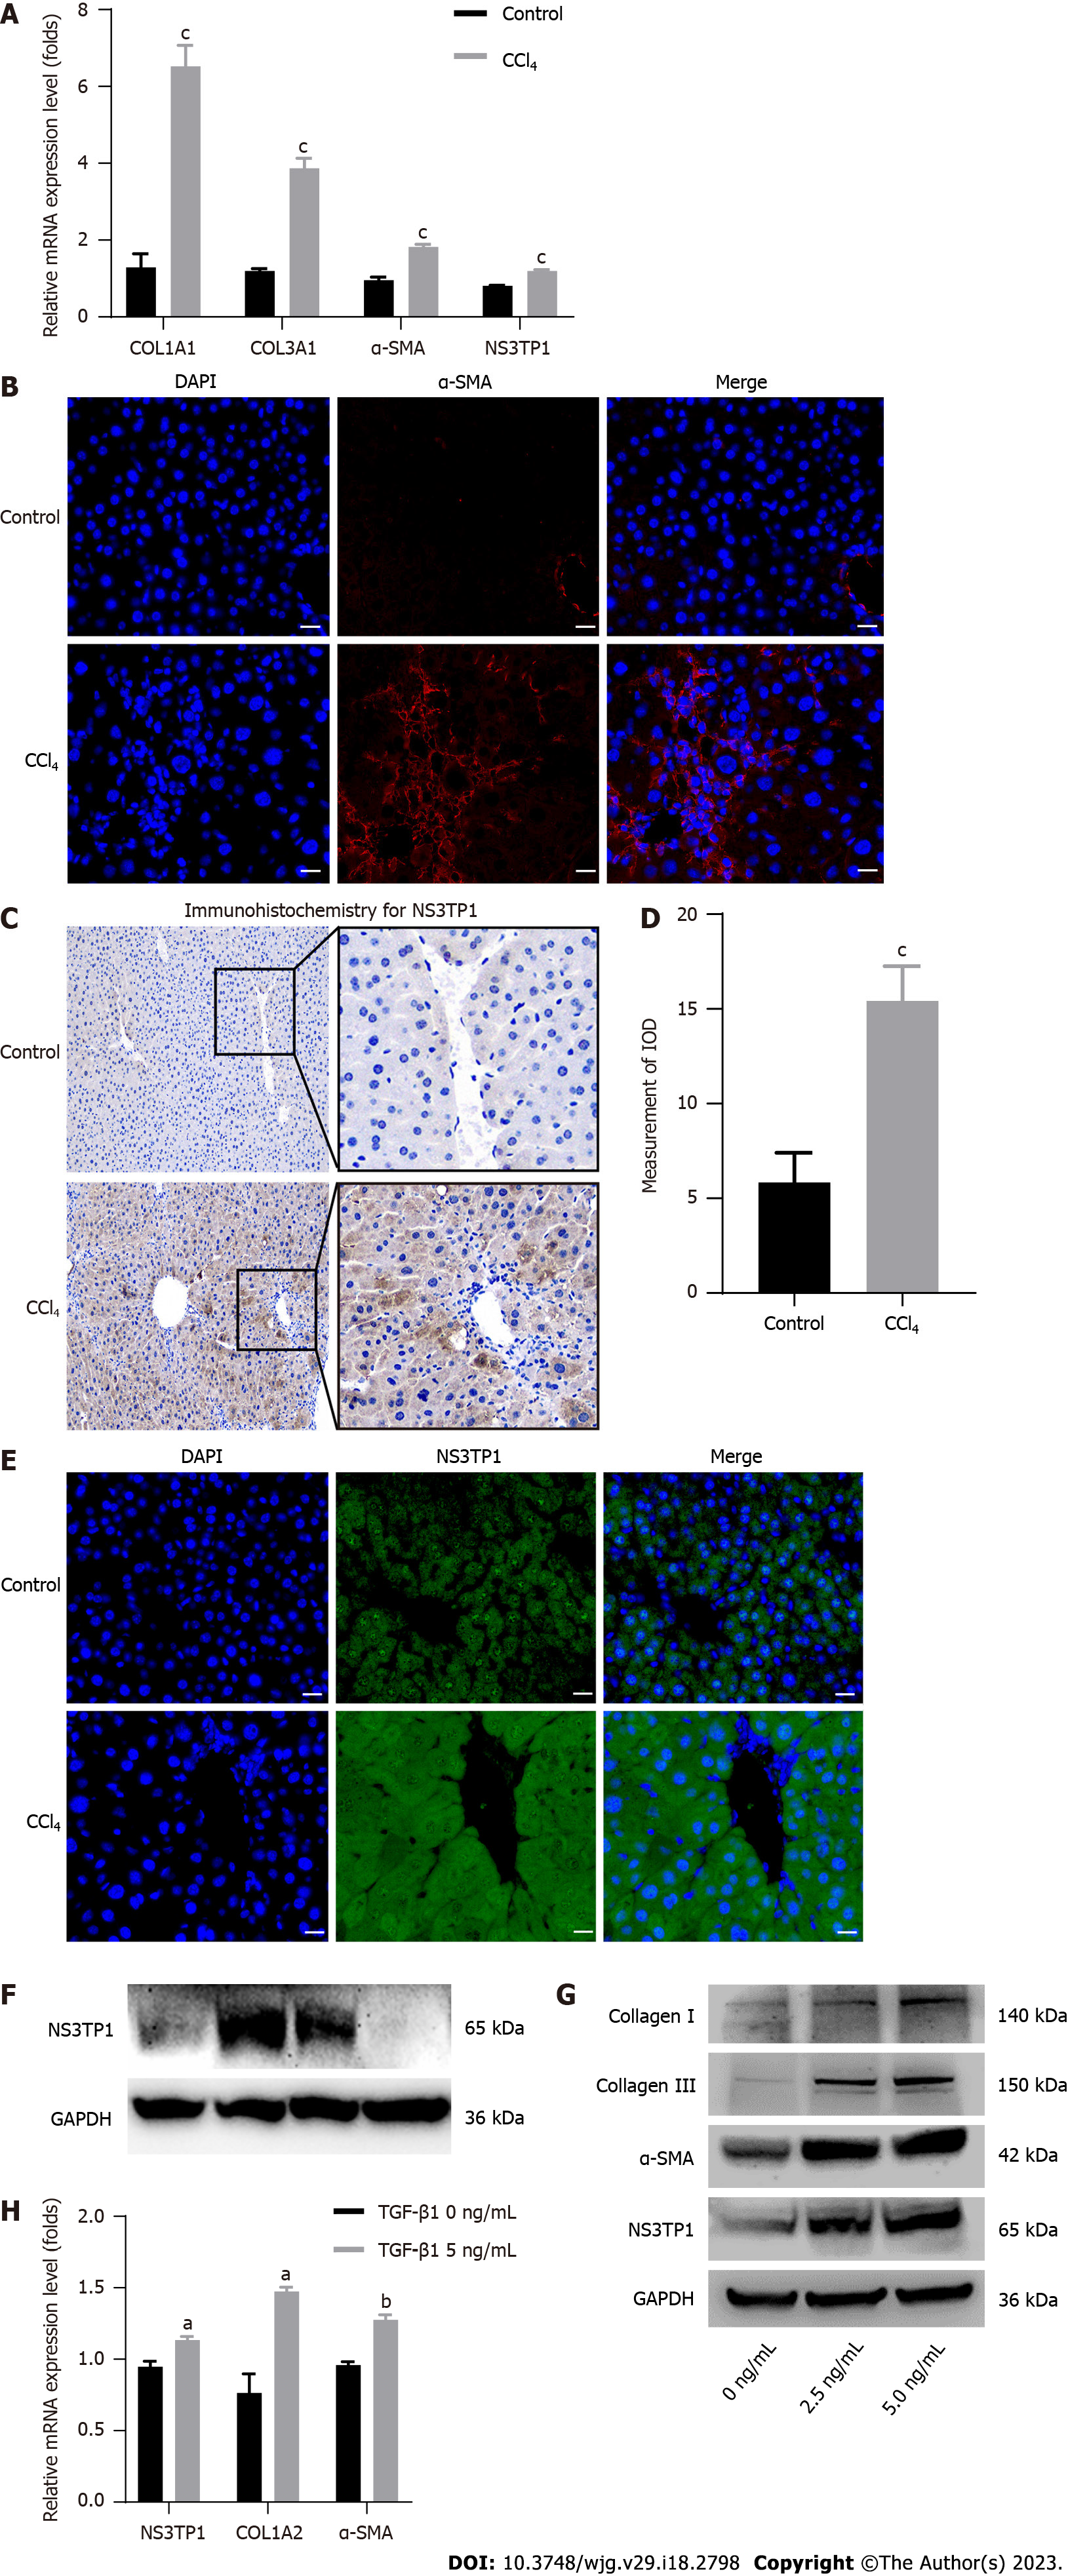
Figure 1 Evaluation of nonstructural protein 3-transactivated protein 1 expression in carbon tetrachloride-induced hepatic fibrosis and Transforming growth factor 1 beta 1-stimulated LX-2 cells.
A: Real-time quantitative polymerase chain reaction analysis of fibrosis-related genes in liver tissues (n = 6); B: Immunofluorescence staining for alpha smooth muscle actin (α-SMA); red: α-SMA (n = 3), scale bar = 20 μm; C: Immunohistochemical staining for α-SMA, scale bar = 100 μm; D: Image J analysis of immunohistochemical staining for α-SMA (n = 3); E: Immunofluorescence staining for nonstructural protein 3-transactivated protein 1 (NS3TP1); green: NS3TP1 (n = 3), scale bar = 20 μm; F: Western blot analysis of NS3TP1 in L02, LX-2, Huh7, and G2 cells; G and H: NS3TP1 was overexpressed in LX-2 cells treated with transforming growth factor 1 beta 1 (TGFβ1) for 24 h (n = 3). The data was presented as mean ± SE. aP < 0.05, bP < 0.01 vs TGFβ1 (0 ng/mL) group; cP < 0.01 vs corn oil control group. NS3TP1: Nonstructural protein 3-transactivated protein 1; TGFβ1: Transforming growth factor 1 beta 1; CCl4: Carbon tetrachloride; RT-qPCR: Real-time quantitative polymerase chain reaction; α-SMA: Alpha smooth muscle actin.
- Citation: Shi L, Zhou L, Han M, Zhang Y, Zhang Y, Yuan XX, Lu HP, Wang Y, Yang XL, Liu C, Wang J, Liang P, Liu SA, Liu XJ, Cheng J, Lin SM. Calcitriol attenuates liver fibrosis through hepatitis C virus nonstructural protein 3-transactivated protein 1-mediated TGF β1/Smad3 and NF-κB signaling pathways. World J Gastroenterol 2023; 29(18): 2798-2817
- URL: https://www.wjgnet.com/1007-9327/full/v29/i18/2798.htm
- DOI: https://dx.doi.org/10.3748/wjg.v29.i18.2798


