Copyright
©The Author(s) 2023.
World J Gastroenterol. May 7, 2023; 29(17): 2642-2656
Published online May 7, 2023. doi: 10.3748/wjg.v29.i17.2642
Published online May 7, 2023. doi: 10.3748/wjg.v29.i17.2642
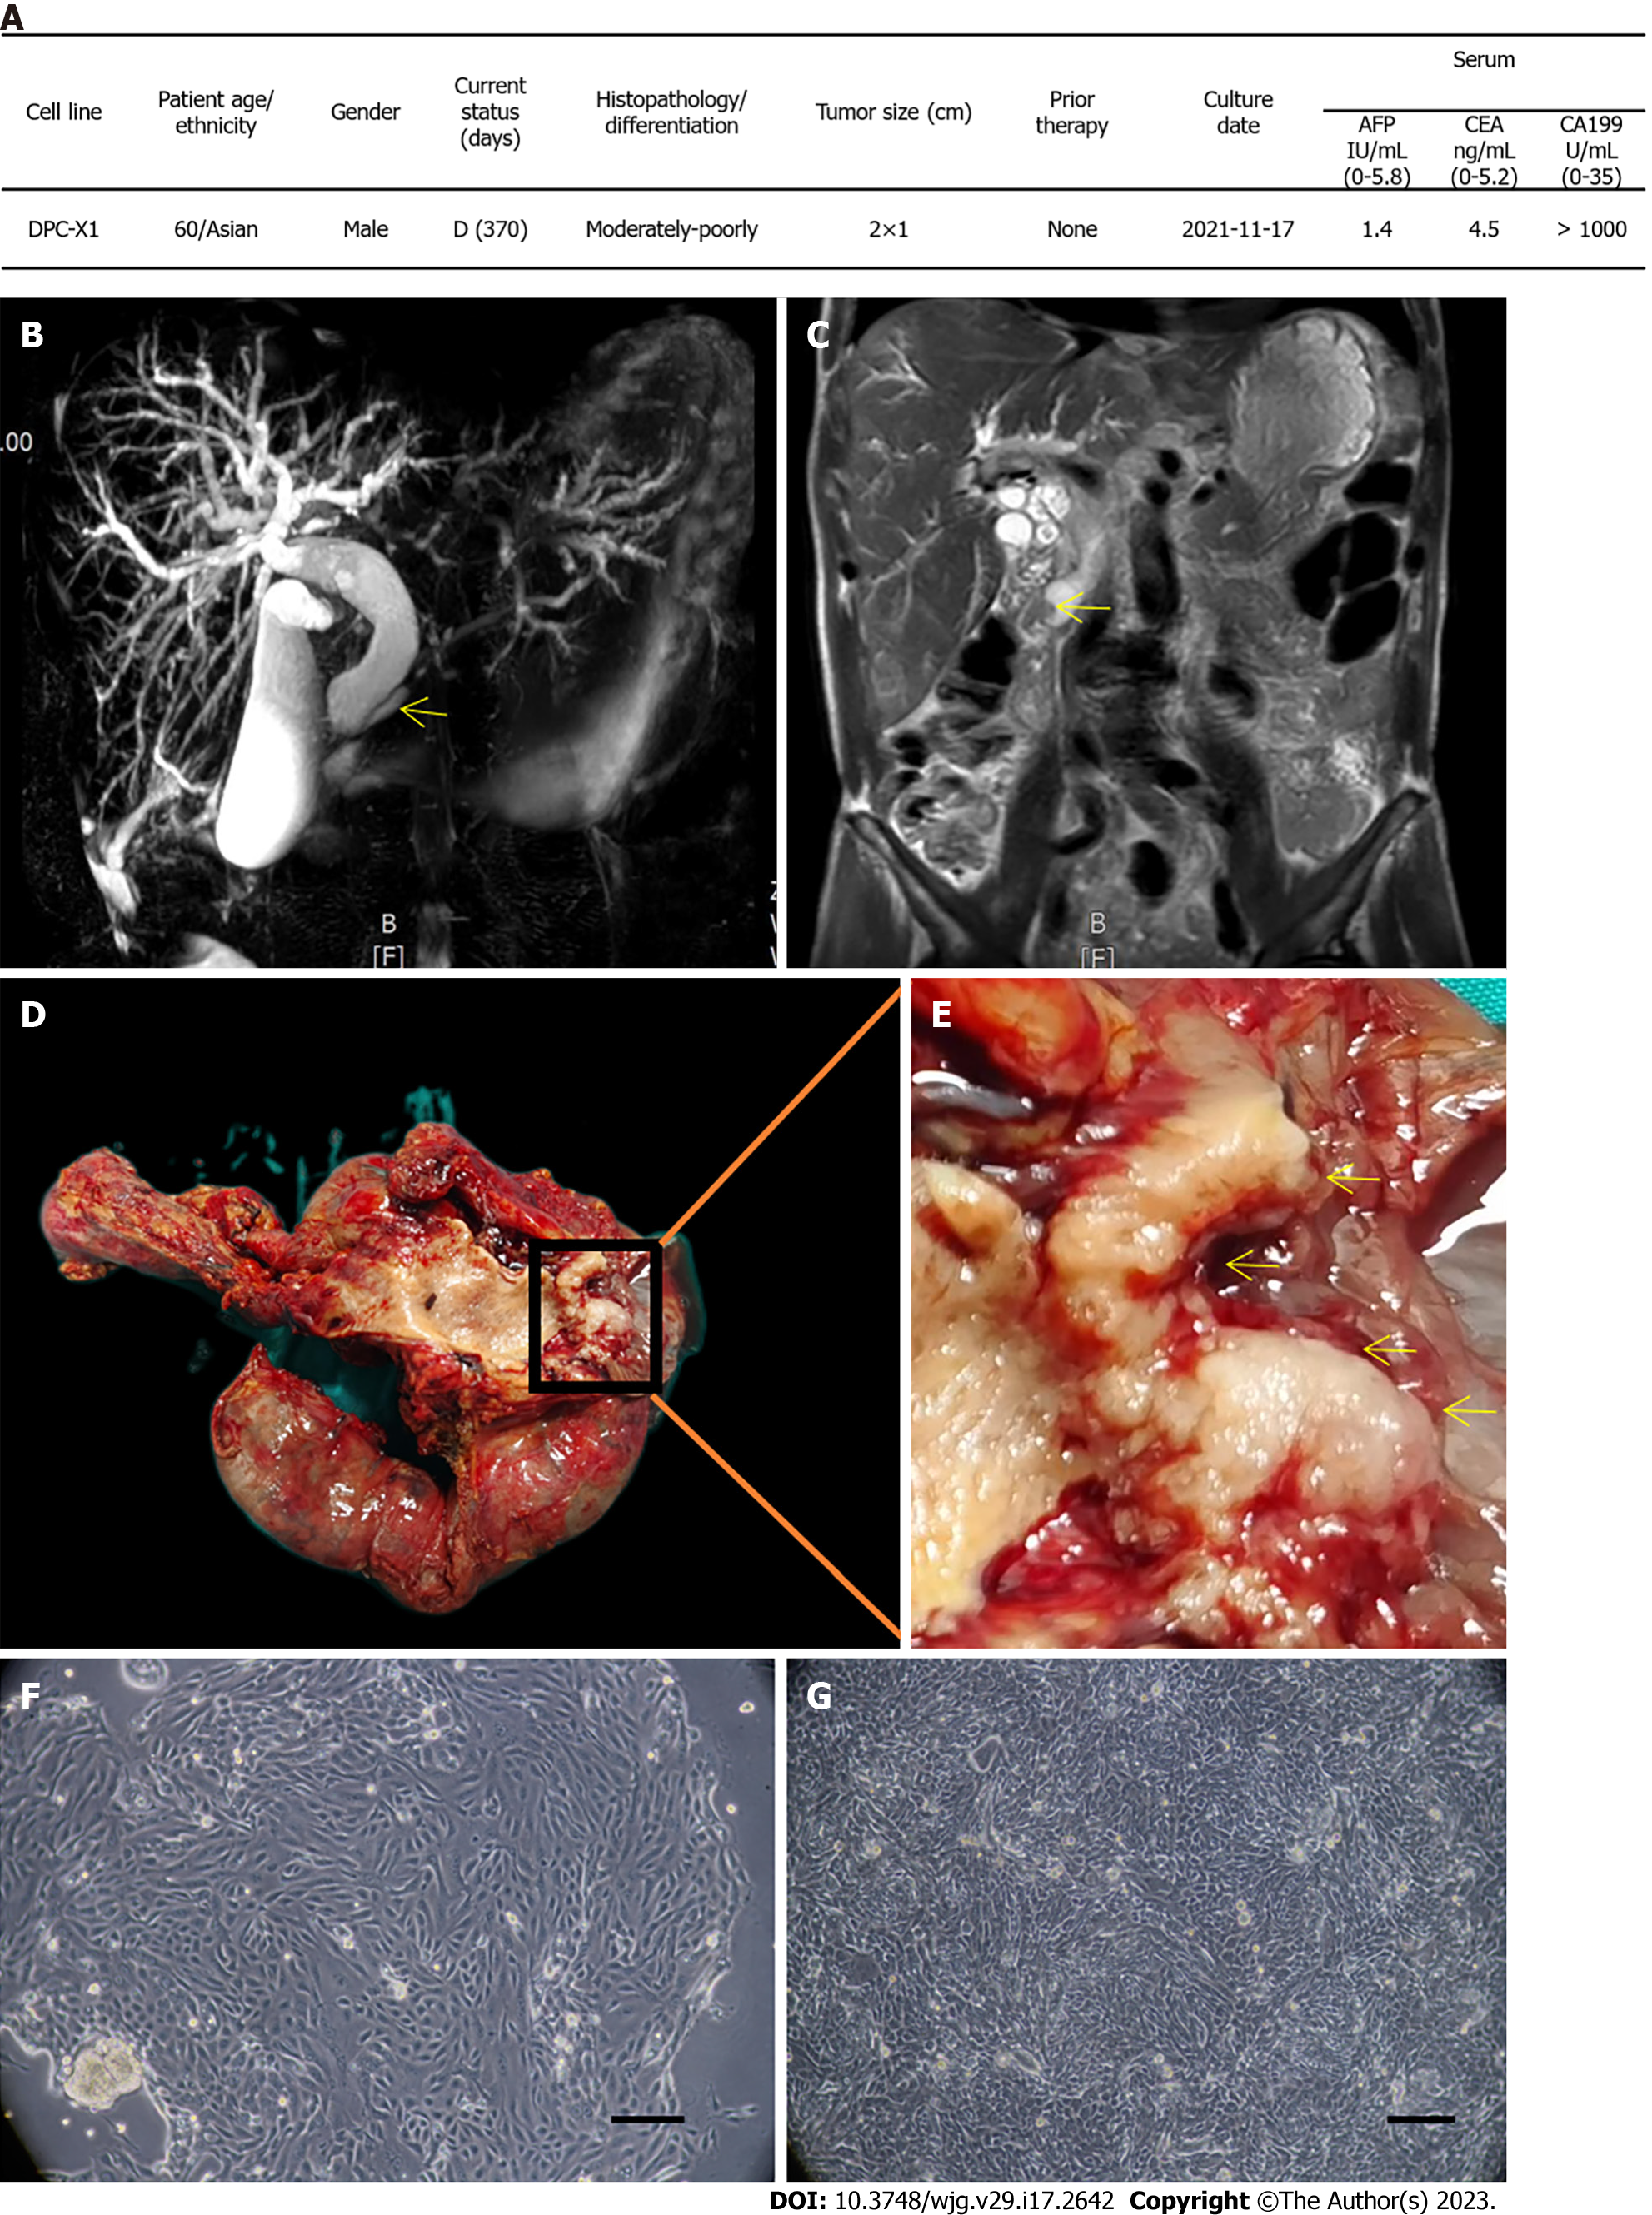
Figure 1 Clinical data and cell morphology.
A: Clinical data of the patient; B: Magnetic resonance cholangiopancreatography shows the expansion of intrahepatic and extrahepatic bile ducts, gallbladder enlargement, and pancreatic duct expansion (arrow); C: In the coronal view of magnetic resonance imaging, soft tissue shadow (arrow) can be seen in the ampulla, and the upper bile duct is dilated; D: General view of the surgical specimen; E: The enlarged appearance of the ampulla tumor shows the gray-white tumor growing around the ampulla (arrow); F: DPC-X1 primary cell morphology; multinucleated cells and megakaryocytes can be seen; G: DPC-X1 cell morphology of the 80th generation. Scale bars: 100 μm. D: Death; AFP: alpha-fetoprotein; CEA: Carcinoembryonic antigen; CA199: Carbohydrate antigen 199.
- Citation: Xu H, Chai CP, Miao X, Tang H, Hu JJ, Zhang H, Zhou WC. Establishment and characterization of a new human ampullary carcinoma cell line, DPC-X1. World J Gastroenterol 2023; 29(17): 2642-2656
- URL: https://www.wjgnet.com/1007-9327/full/v29/i17/2642.htm
- DOI: https://dx.doi.org/10.3748/wjg.v29.i17.2642


