Copyright
©The Author(s) 2023.
World J Gastroenterol. Apr 14, 2023; 29(14): 2172-2187
Published online Apr 14, 2023. doi: 10.3748/wjg.v29.i14.2172
Published online Apr 14, 2023. doi: 10.3748/wjg.v29.i14.2172
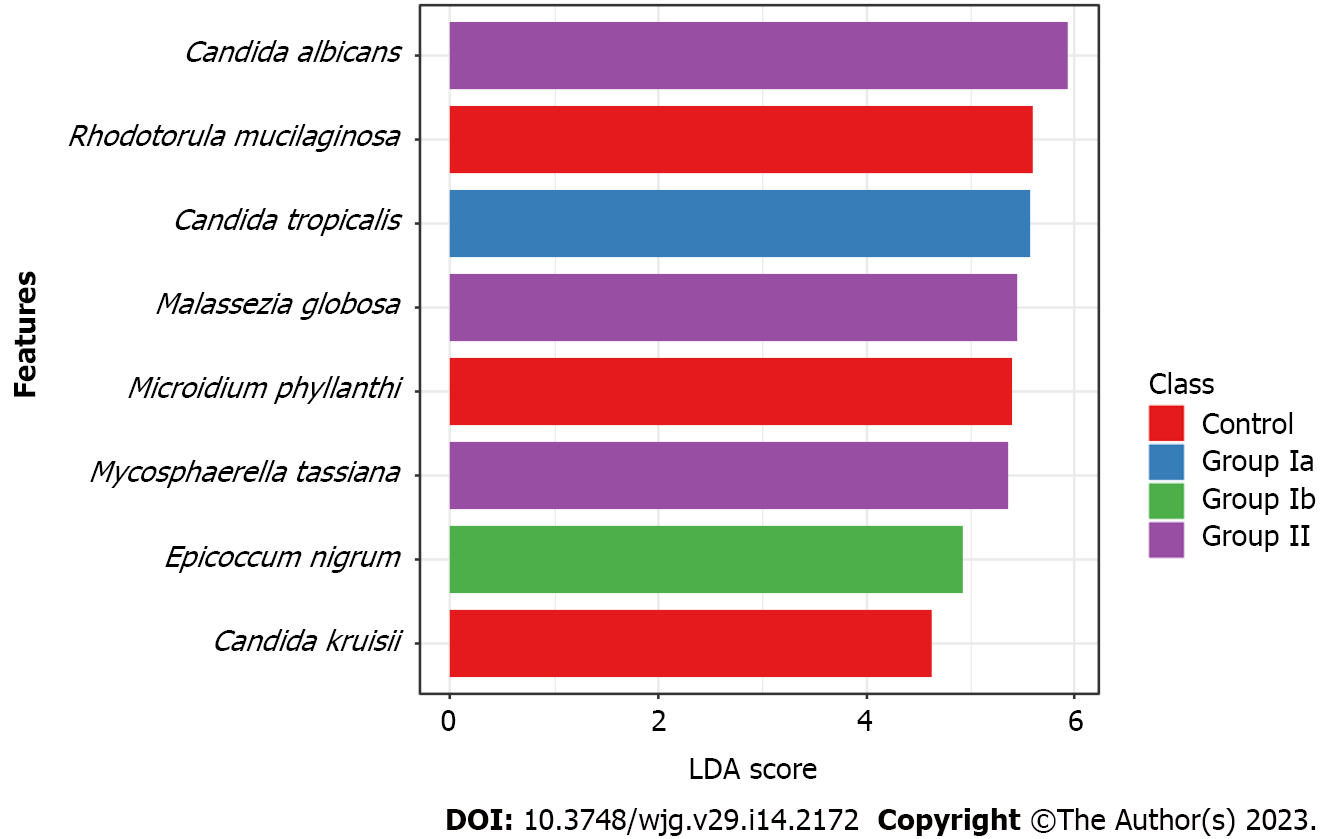
Figure 4 Histogram of the linear discriminant analysis logarithmic scores for statistically different fungi between study and control groups.
Positive linear discriminant analysis scores represent fungi that were over-abundant in Group Ia–active/newly diagnosed Crohn's disease (CD) (blue bars), Group Ib–active/previously diagnosed and treated CD (green bars), Group II–non-active CD (purple bars), and control–healthy subjects (red bars) groups.
- Citation: Krawczyk A, Salamon D, Kowalska-Duplaga K, Zapała B, Książek T, Drażniuk-Warchoł M, Gosiewski T. Changes in the gut mycobiome in pediatric patients in relation to the clinical activity of Crohn's disease. World J Gastroenterol 2023; 29(14): 2172-2187
- URL: https://www.wjgnet.com/1007-9327/full/v29/i14/2172.htm
- DOI: https://dx.doi.org/10.3748/wjg.v29.i14.2172


