Copyright
©The Author(s) 2023.
World J Gastroenterol. Apr 14, 2023; 29(14): 2134-2152
Published online Apr 14, 2023. doi: 10.3748/wjg.v29.i14.2134
Published online Apr 14, 2023. doi: 10.3748/wjg.v29.i14.2134
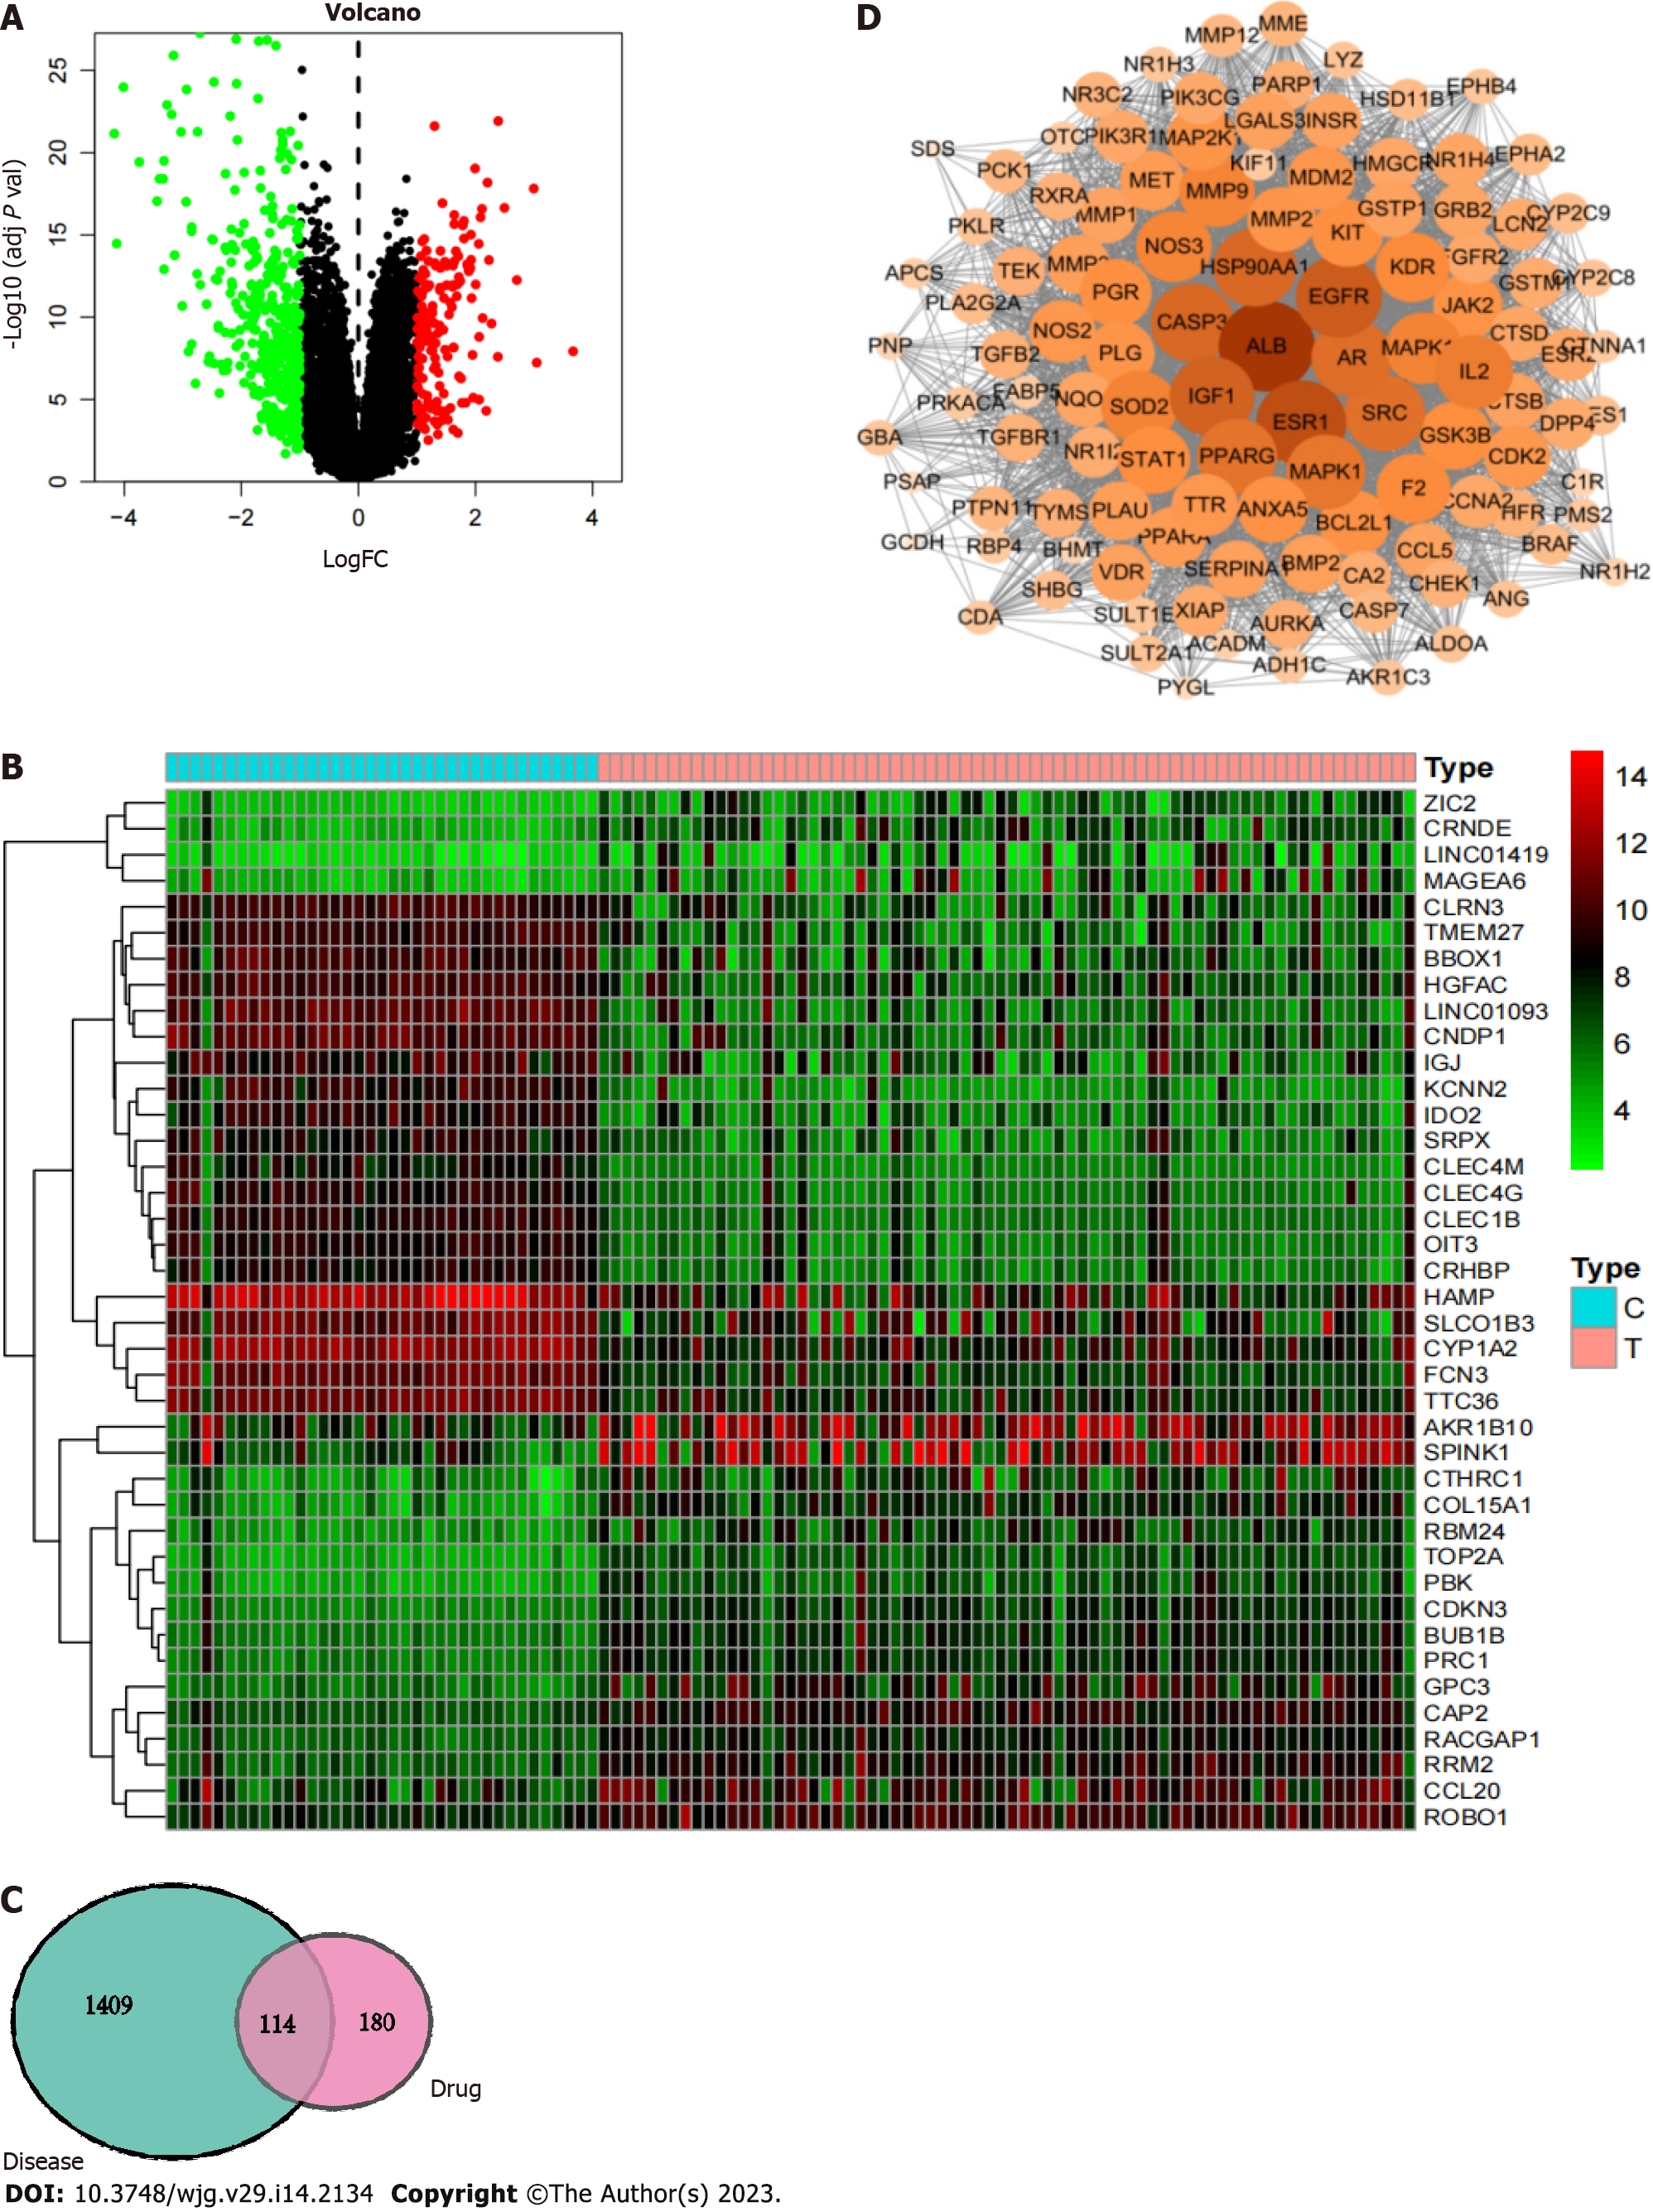
Figure 6 Network pharmacology illustration.
A: Differential gene volcano plot; B: Differential gene heatmap. Up- and downregulated differentially expressed genes can be derived from volcano plots and heatmaps; C: Venn diagram of the common targets of carrimycin and liver cancer. The common disease-drug targets were determined from this map; D: Protein-protein interaction network of carrimycin and acquisition of the core targets of carrimycin in liver cancer.
- Citation: Li XY, Luo YT, Wang YH, Yang ZX, Shang YZ, Guan QX. Anti-inflammatory effect and antihepatoma mechanism of carrimycin. World J Gastroenterol 2023; 29(14): 2134-2152
- URL: https://www.wjgnet.com/1007-9327/full/v29/i14/2134.htm
- DOI: https://dx.doi.org/10.3748/wjg.v29.i14.2134


