Copyright
©The Author(s) 2023.
World J Gastroenterol. Apr 7, 2023; 29(13): 2034-2049
Published online Apr 7, 2023. doi: 10.3748/wjg.v29.i13.2034
Published online Apr 7, 2023. doi: 10.3748/wjg.v29.i13.2034
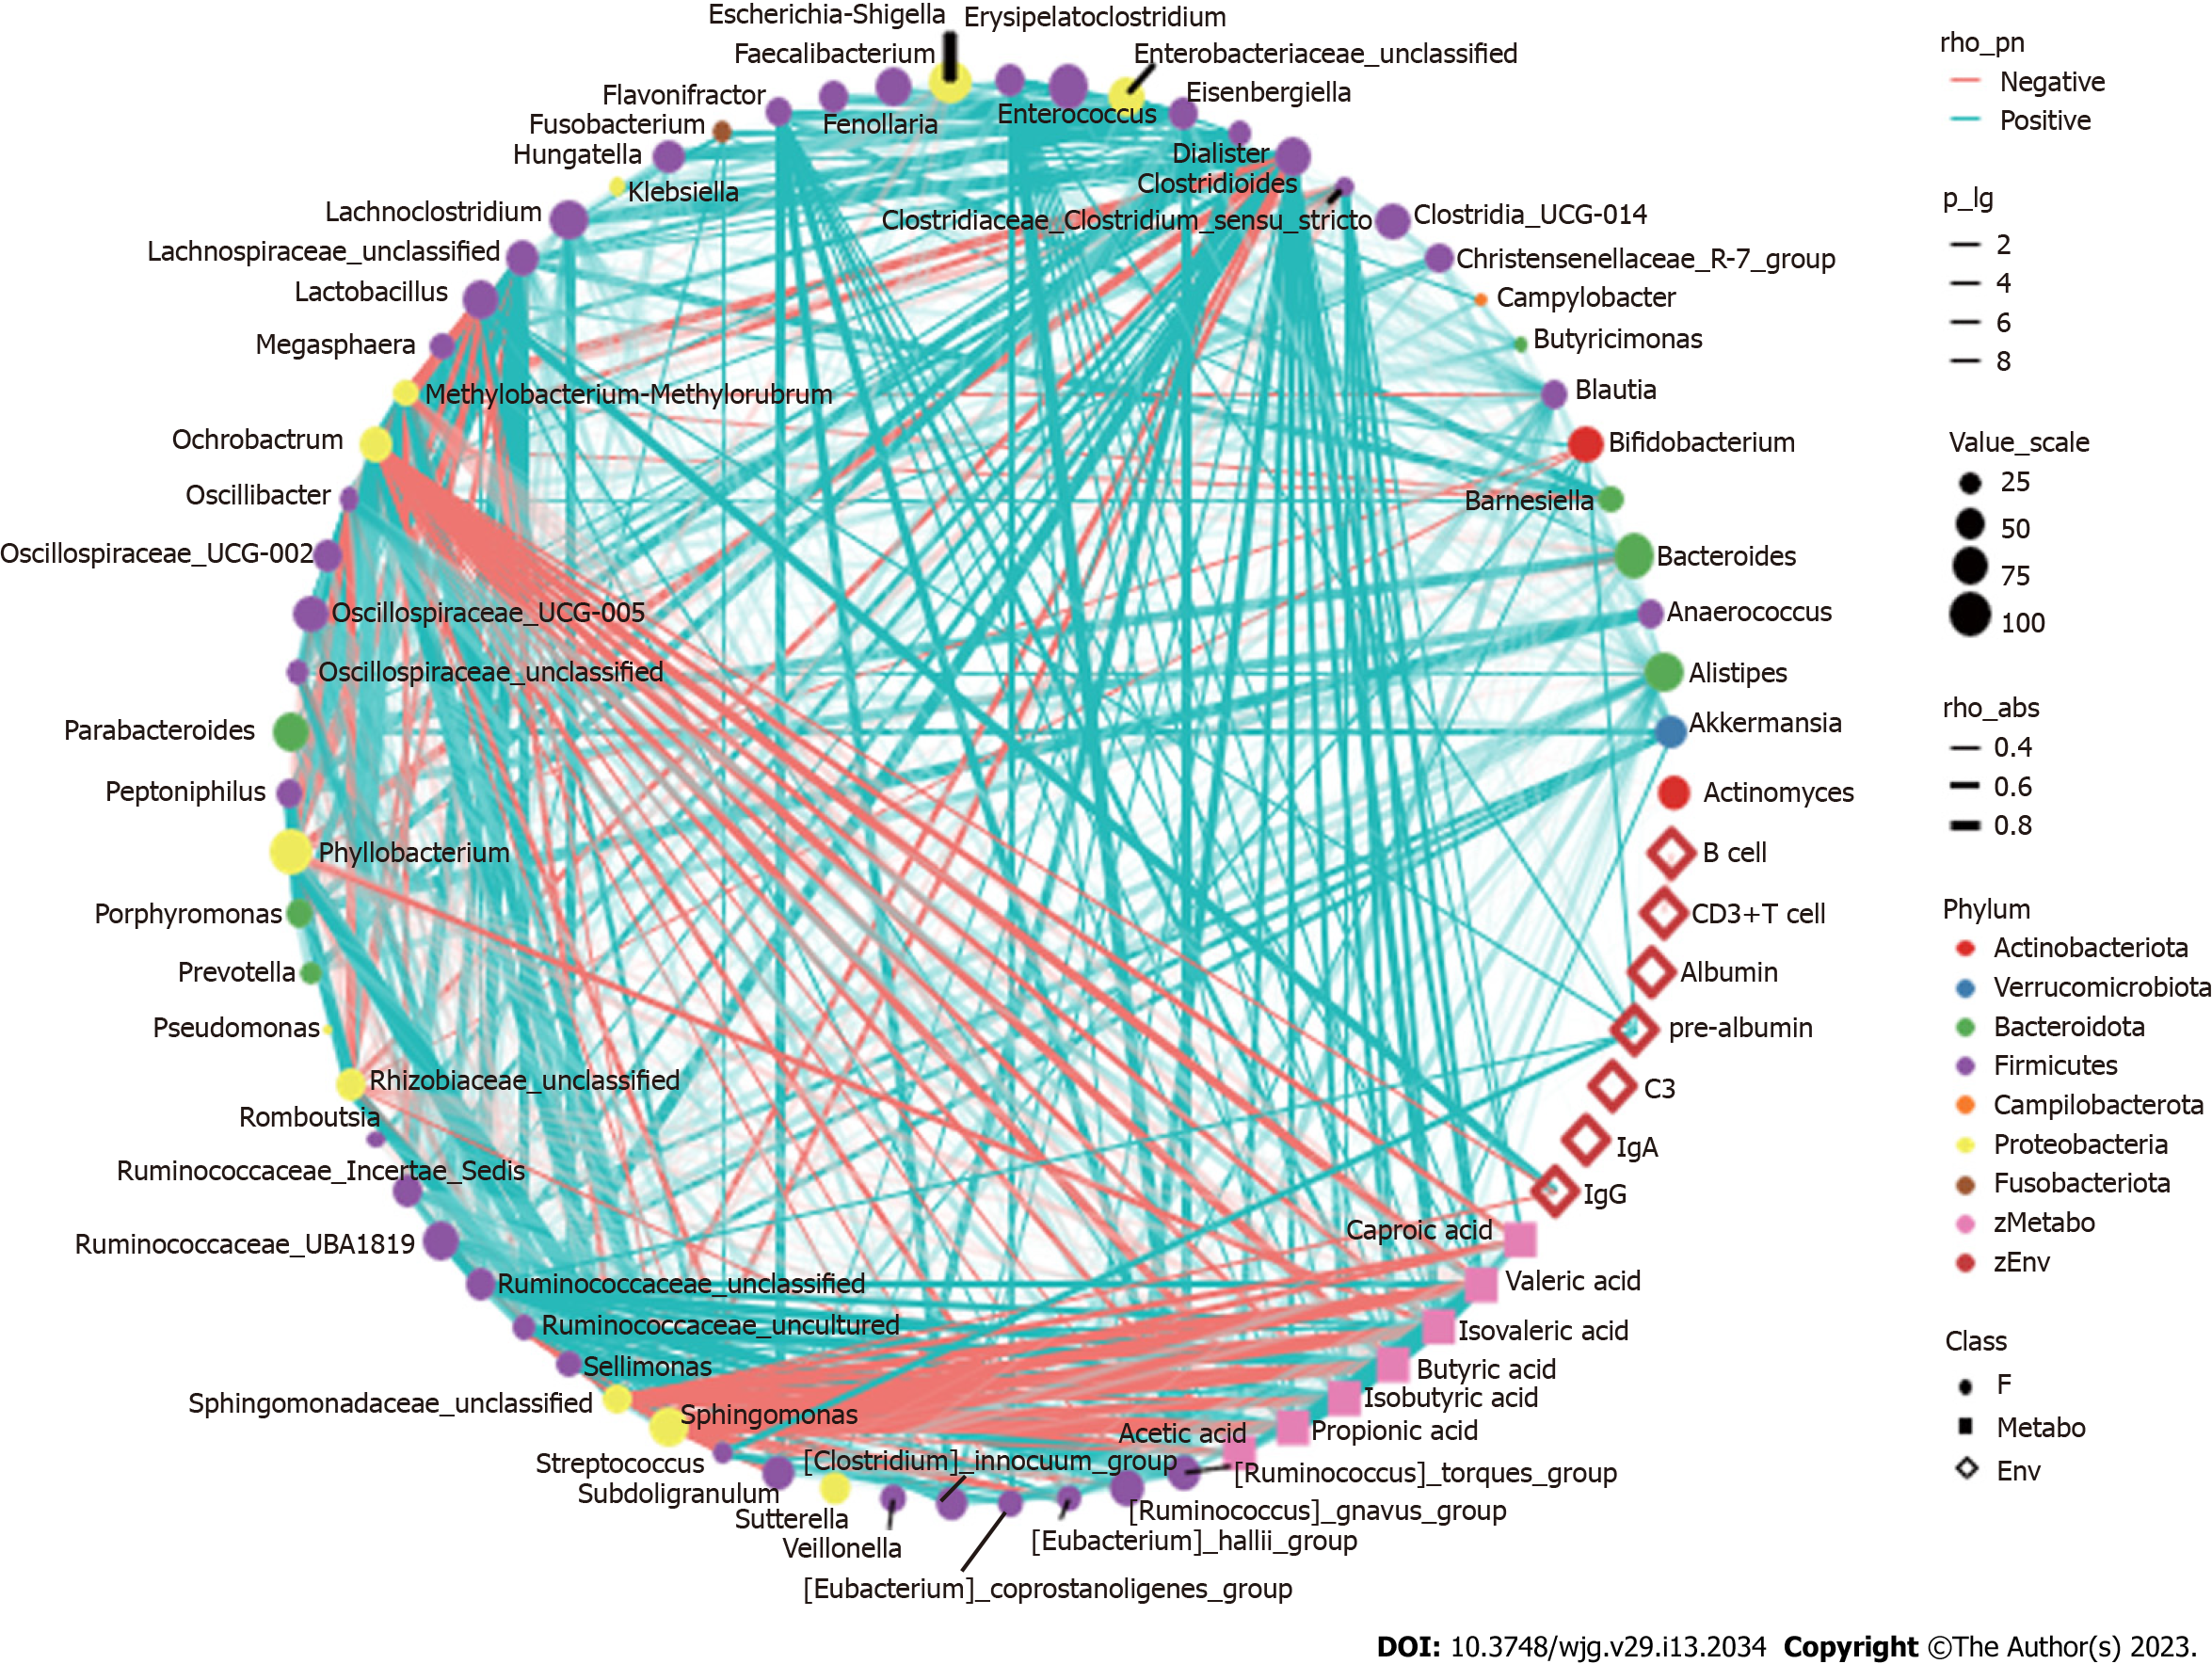
Figure 6 Correlation analysis between gut microbiomes, short-chain fatty acids and nutritional immune indicators after nutritional support for patients with sepsis.
Network graph constructs based on Spearman’s correlation analysis. The results showed correlations among 60 predominant fecal microbial genera, 7 short-chain fatty acids (SCFAs) and 7 clinical immune and nutritional indicators. Connecting lines represent the significant correlation (P < 0.05). Red lines indicate negative correlations, blue lines indicate positive correlations, and the width of the lines represents the strength of the correlation. The transparency of the lines represented the negative logarithm of the P value of correlation. The size of the points indicates the relative abundance of genera. The colors of points display the different phyla of the microbiome. The circle represents the fecal microbiome, the square represents the SCFAs, and the diamond represents plasma metabolites.
- Citation: Yang XJ, Wang XH, Yang MY, Ren HY, Chen H, Zhang XY, Liu QF, Yang G, Yang Y, Yang XJ. Exploring choices of early nutritional support for patients with sepsis based on changes in intestinal microecology. World J Gastroenterol 2023; 29(13): 2034-2049
- URL: https://www.wjgnet.com/1007-9327/full/v29/i13/2034.htm
- DOI: https://dx.doi.org/10.3748/wjg.v29.i13.2034


