Copyright
©The Author(s) 2023.
World J Gastroenterol. Mar 28, 2023; 29(12): 1875-1898
Published online Mar 28, 2023. doi: 10.3748/wjg.v29.i12.1875
Published online Mar 28, 2023. doi: 10.3748/wjg.v29.i12.1875
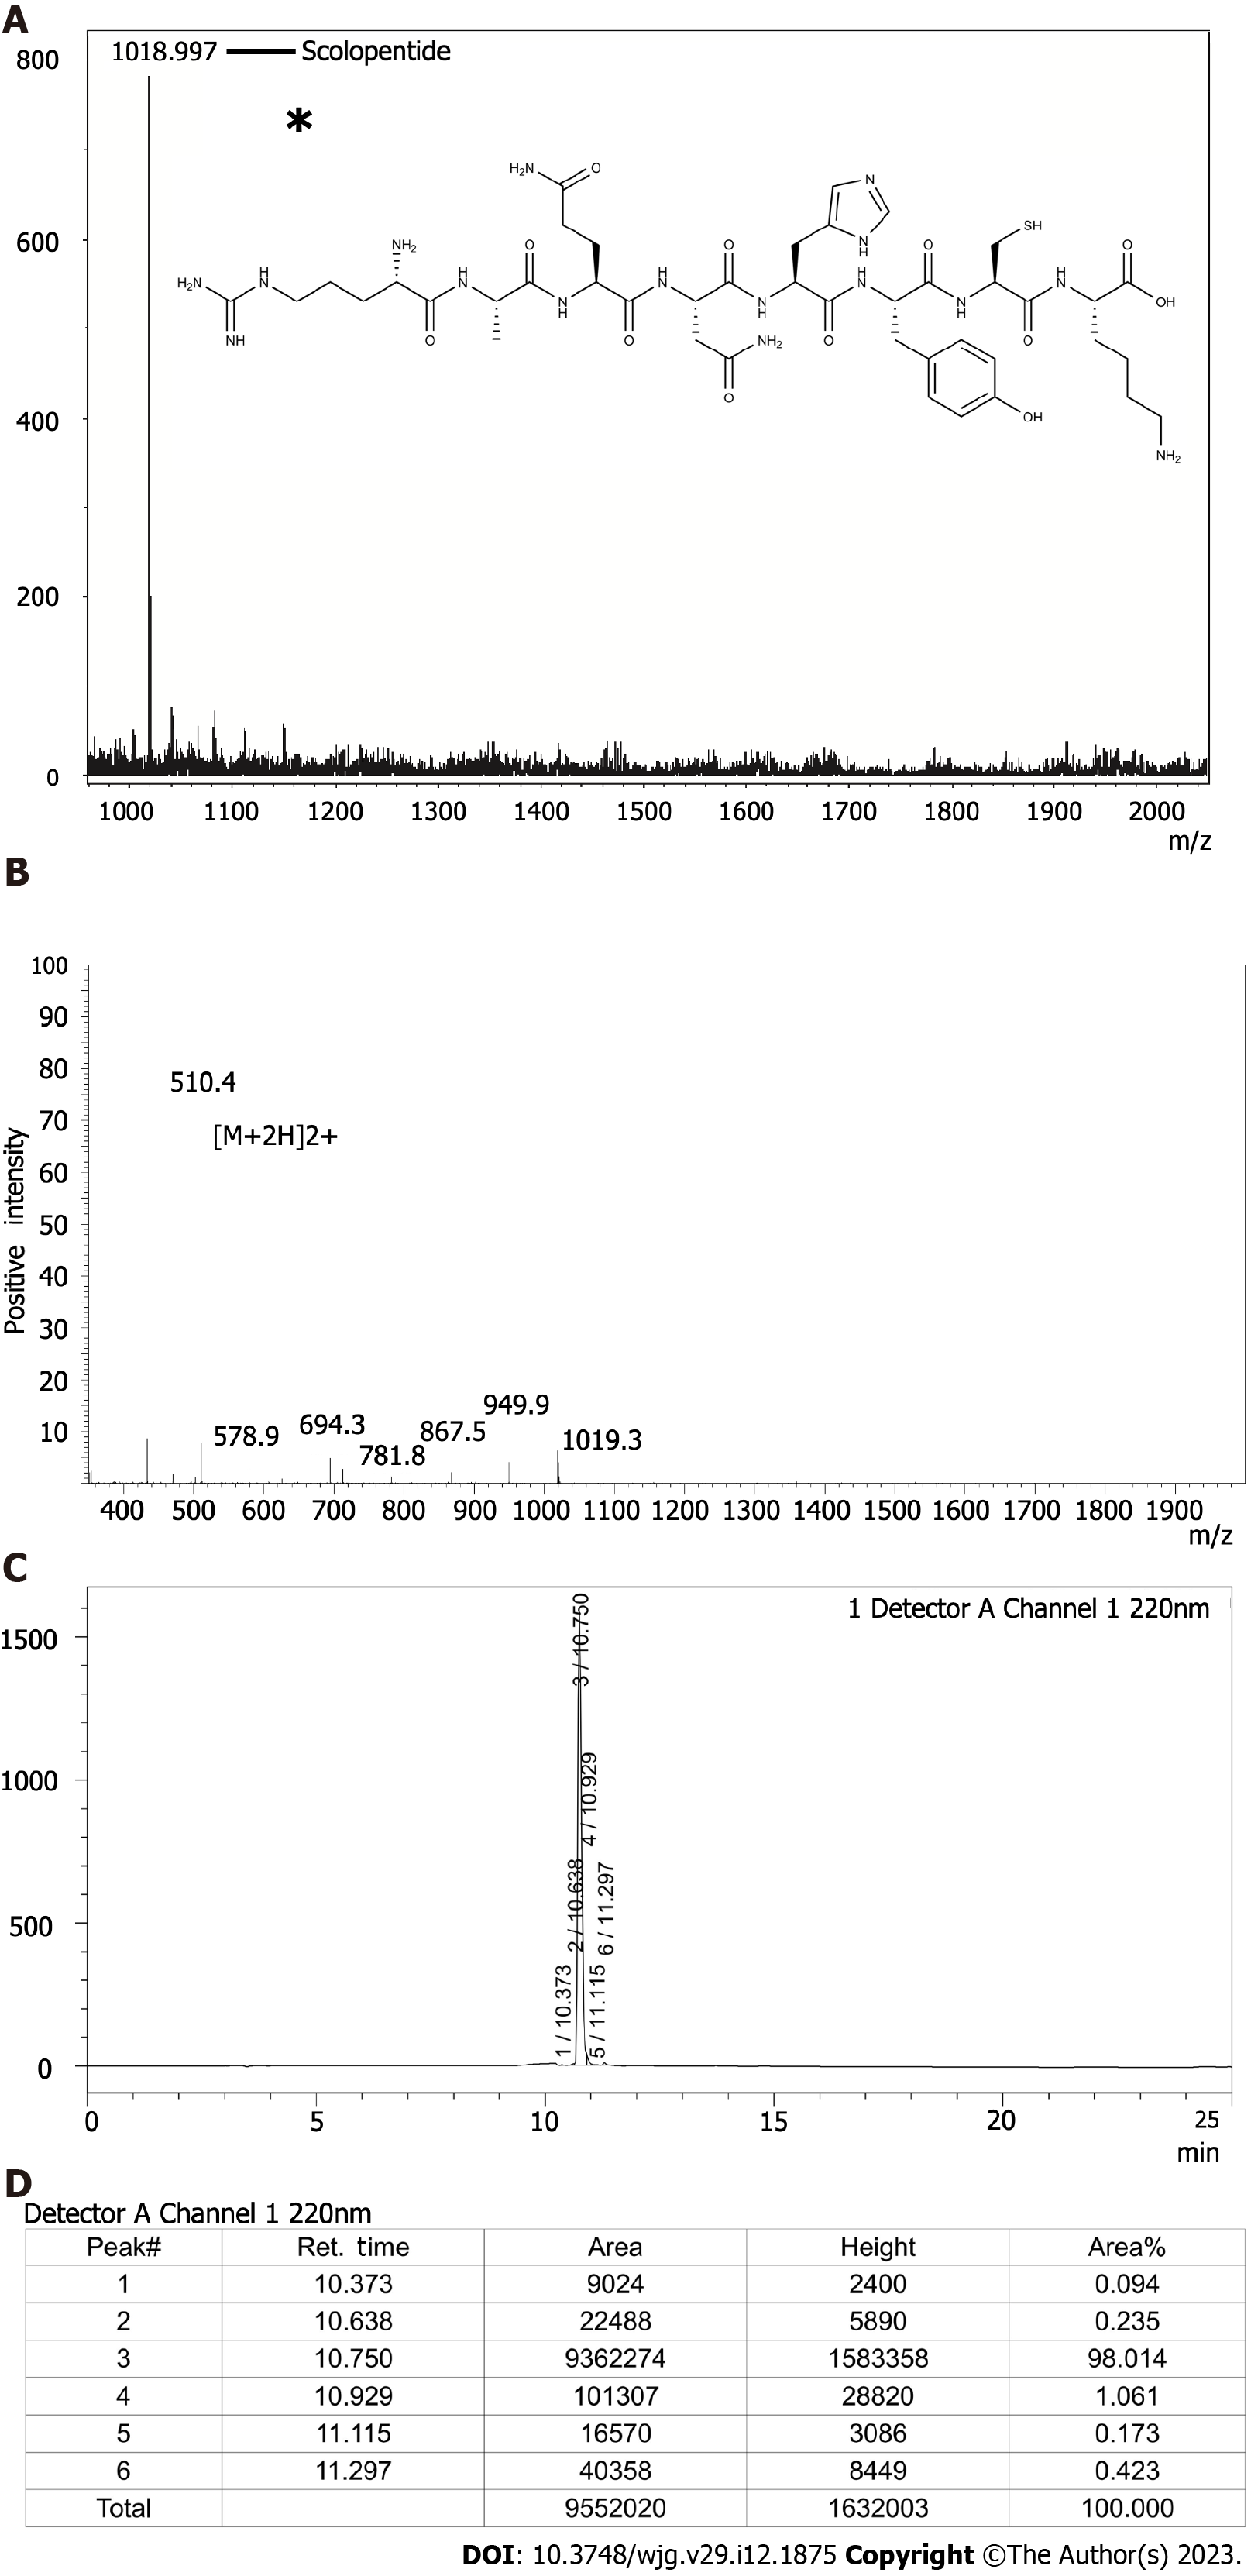
Figure 2 Characterization of extracted scolopentide and detection of synthetic scolopentide.
A: Mass spectrum of extracted scolopentide; the highest peak indicates the active peptide (scolopentide). The observed molecular weight was 1018.997 Da; the asterisk “*” means molecular structure of scolopentide; B: Mass spectrum of synthetic scolopentide. The observed molecular weight was 1018.8 Da; C and D: HPLC chromatogram of synthetic scolopentide (C); the highest peak (peak 3) indicates the active peptide, and the area % of peak 3 indicates the purity of synthetic scolopentide (98.014%) (D).
- Citation: Hu YX, Liu Z, Zhang Z, Deng Z, Huang Z, Feng T, Zhou QH, Mei S, Yi C, Zhou Q, Zeng PH, Pei G, Tian S, Tian XF. Antihepatoma peptide, scolopentide, derived from the centipede scolopendra subspinipes mutilans. World J Gastroenterol 2023; 29(12): 1875-1898
- URL: https://www.wjgnet.com/1007-9327/full/v29/i12/1875.htm
- DOI: https://dx.doi.org/10.3748/wjg.v29.i12.1875


