Copyright
©The Author(s) 2022.
World J Gastroenterol. Feb 28, 2022; 28(8): 811-824
Published online Feb 28, 2022. doi: 10.3748/wjg.v28.i8.811
Published online Feb 28, 2022. doi: 10.3748/wjg.v28.i8.811
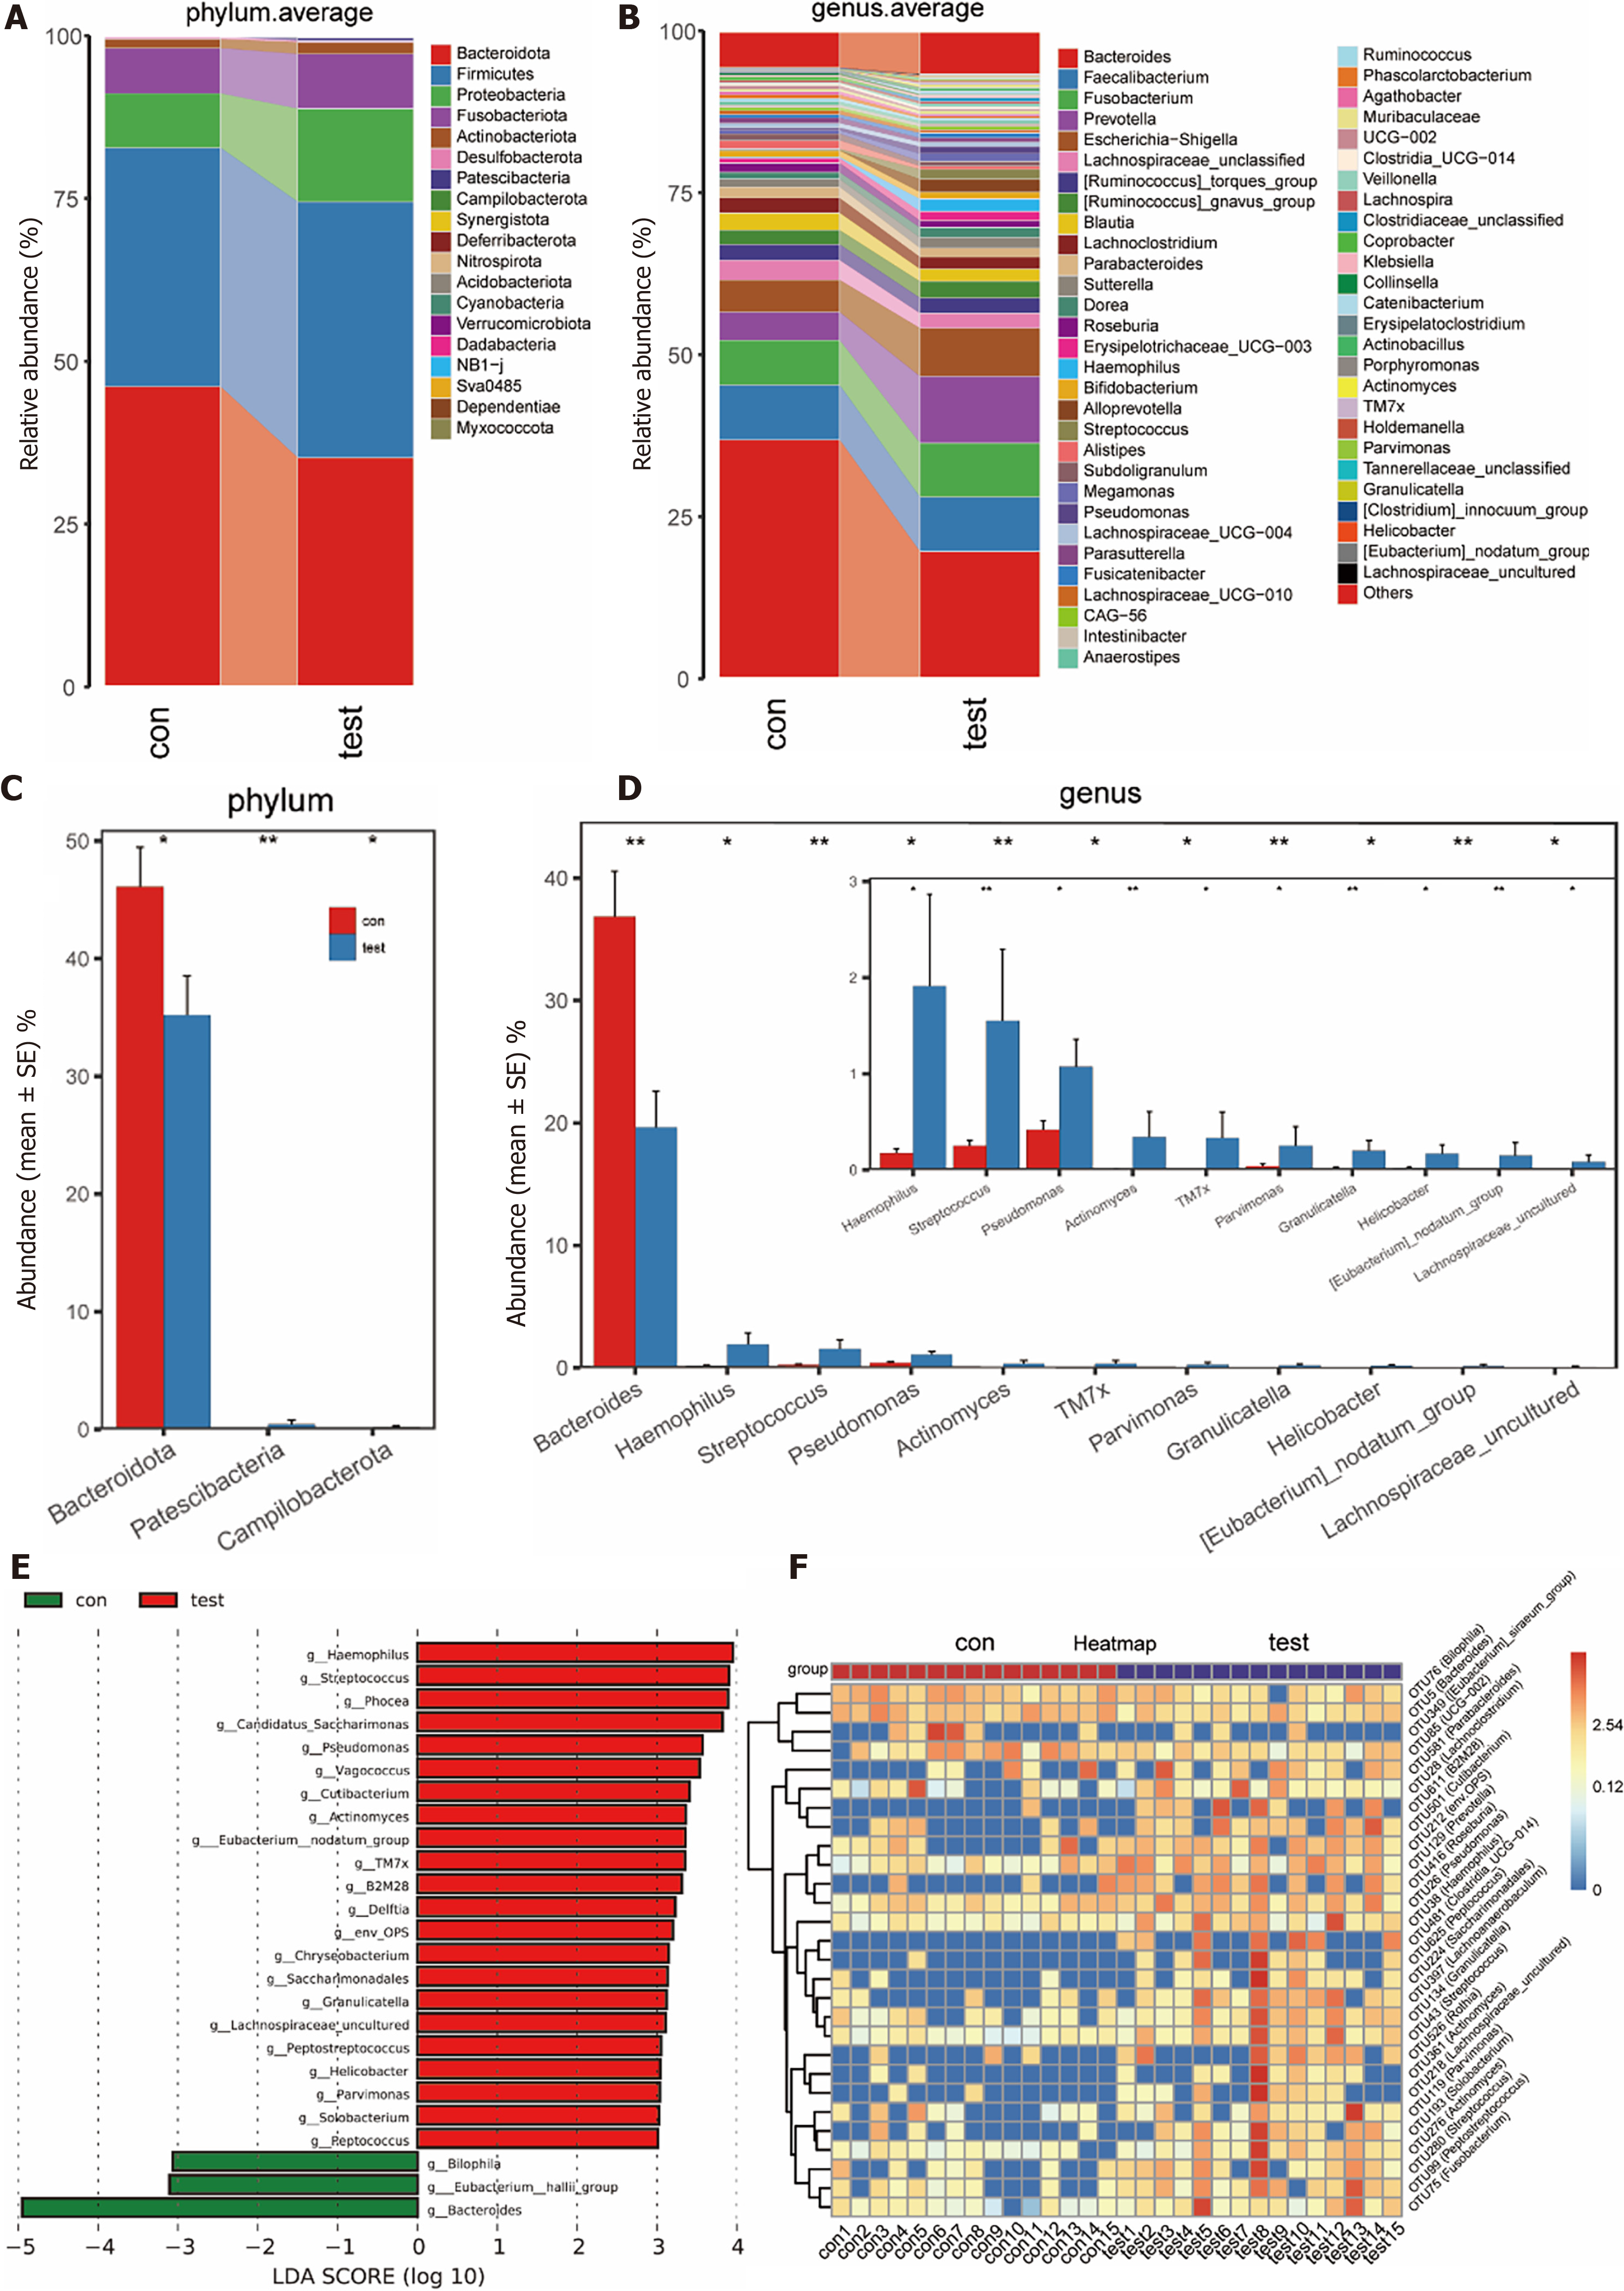
Figure 4 Flora composition and comparison of microbiome composition in both groups.
A: Flora composition at the phylum level; B: Flora composition at the genus level; C: The abundance of Bacteroidetes was significantly lower at the phylum level in the test group, as assessed by a Wilcoxon rank-sum test; D: Differences in the flora at the genus level between the groups, as assessed by a Wilcoxon rank-sum test; E: Flora differences at the genus level, as assessed by Linear discriminant analysis effect size; F: A heatmap analysis of the microbiomes using a random forest model.
- Citation: Jiang QL, Lu Y, Zhang MJ, Cui ZY, Pei ZM, Li WH, Lu LG, Wang JJ, Lu YY. Mucosal bacterial dysbiosis in patients with nodular lymphoid hyperplasia in the terminal ileum. World J Gastroenterol 2022; 28(8): 811-824
- URL: https://www.wjgnet.com/1007-9327/full/v28/i8/811.htm
- DOI: https://dx.doi.org/10.3748/wjg.v28.i8.811


