Copyright
©The Author(s) 2022.
World J Gastroenterol. Feb 28, 2022; 28(8): 811-824
Published online Feb 28, 2022. doi: 10.3748/wjg.v28.i8.811
Published online Feb 28, 2022. doi: 10.3748/wjg.v28.i8.811
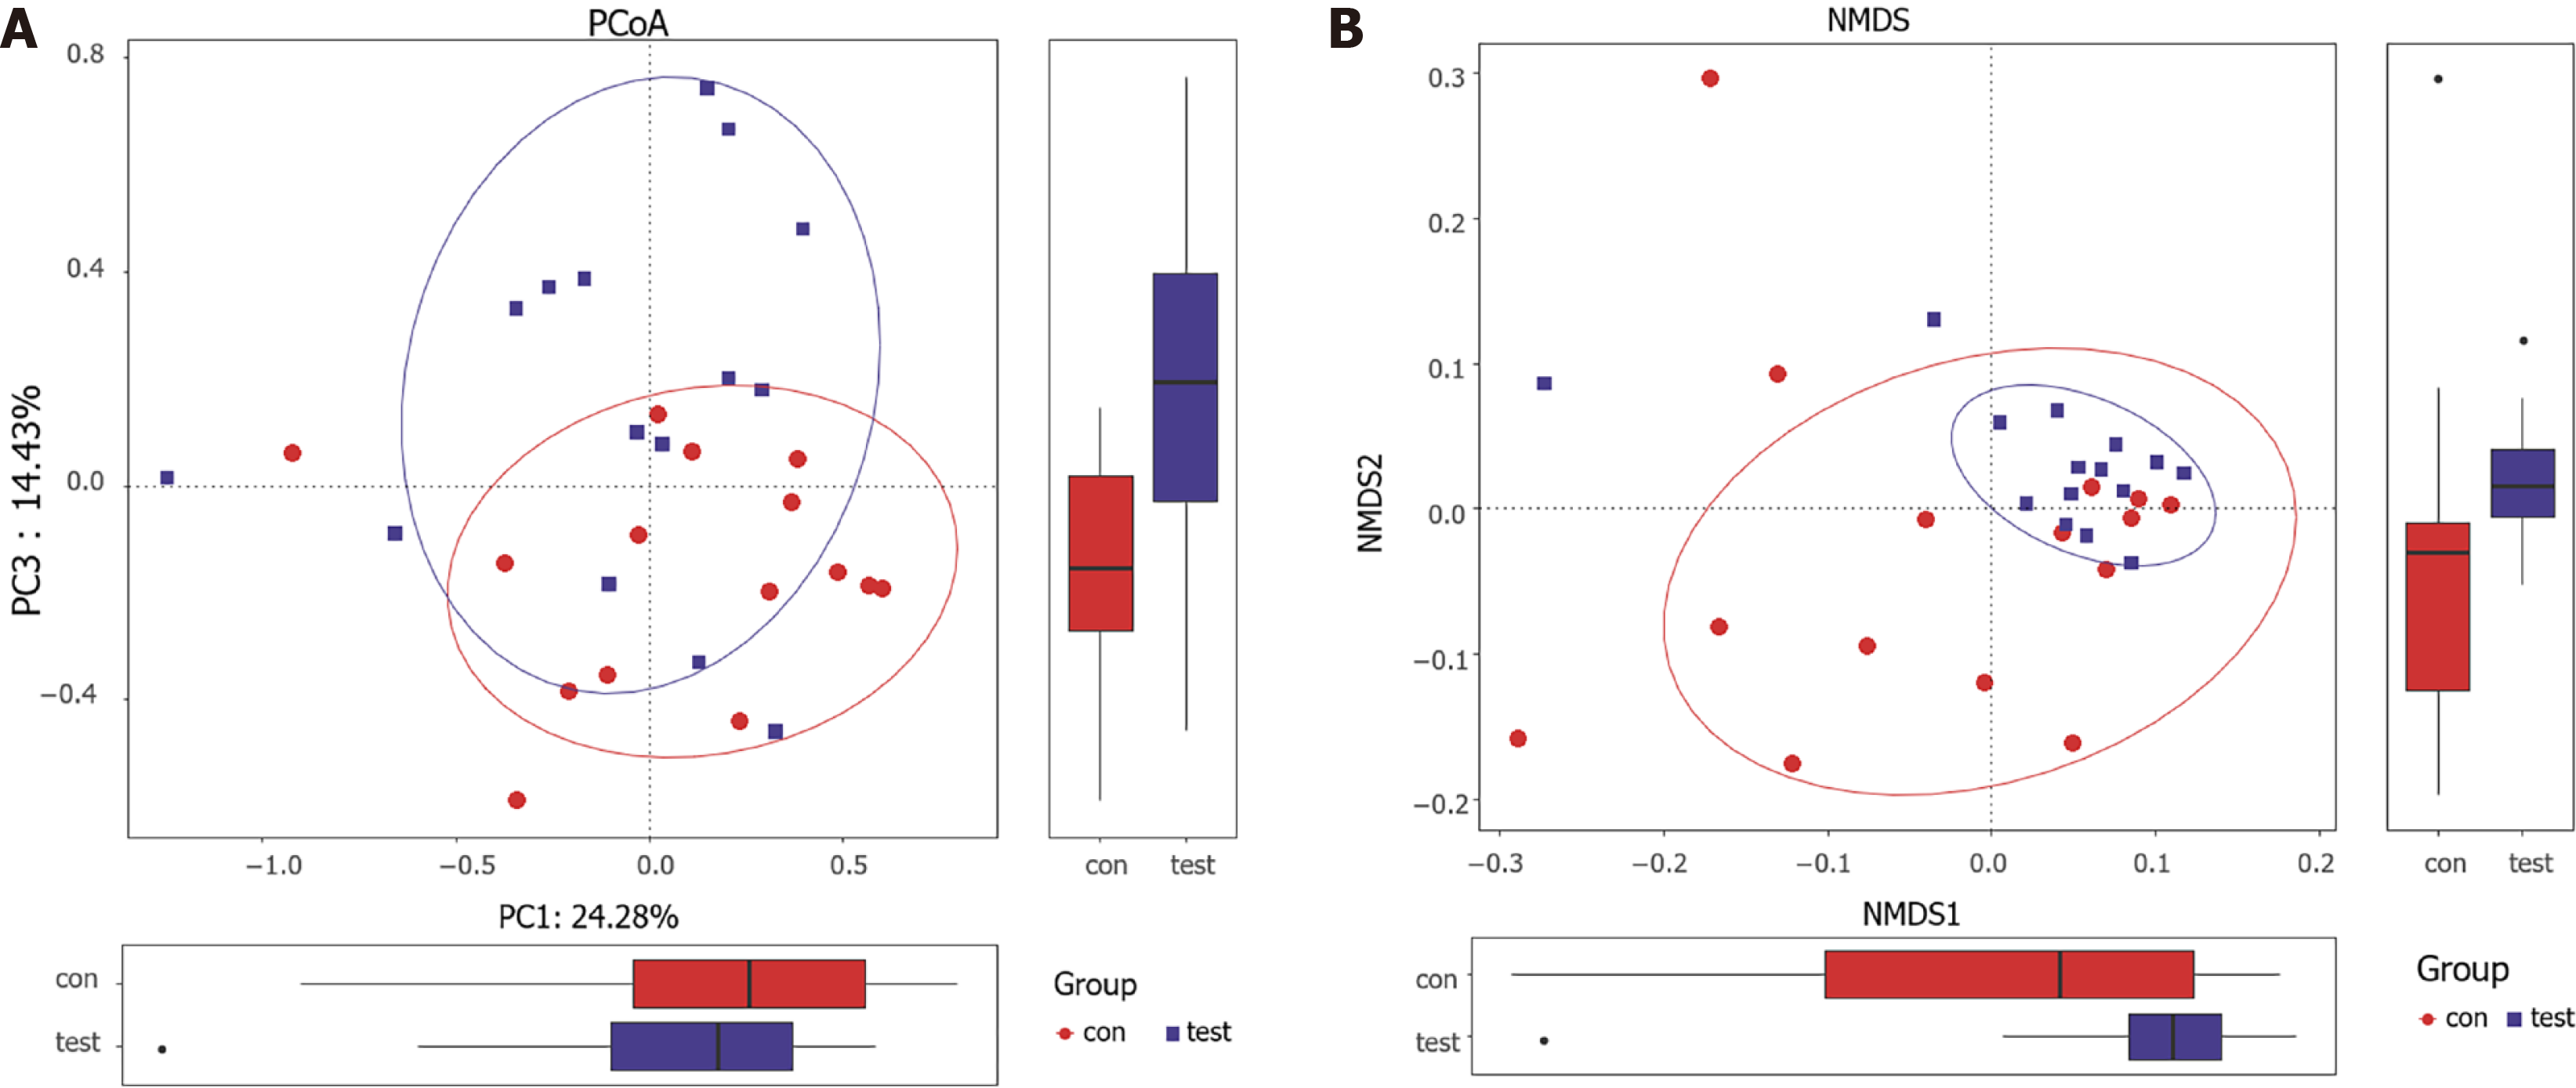
Figure 3 Analysis of beta diversity based on Operational Taxonomic Units levels.
A: Principal coordinates analysis plots based on the Bray-Curtis distances shows the differences in the bacterial flora between the terminal ileal nodular lymphoid hyperplasia and control groups; B: Nonmetric multidimensional scaling analysis based on the Bray-Curtis distances shows the differences between both groups. Each symbol represents one sample.
- Citation: Jiang QL, Lu Y, Zhang MJ, Cui ZY, Pei ZM, Li WH, Lu LG, Wang JJ, Lu YY. Mucosal bacterial dysbiosis in patients with nodular lymphoid hyperplasia in the terminal ileum. World J Gastroenterol 2022; 28(8): 811-824
- URL: https://www.wjgnet.com/1007-9327/full/v28/i8/811.htm
- DOI: https://dx.doi.org/10.3748/wjg.v28.i8.811


