Copyright
©The Author(s) 2022.
World J Gastroenterol. Feb 14, 2022; 28(6): 653-664
Published online Feb 14, 2022. doi: 10.3748/wjg.v28.i6.653
Published online Feb 14, 2022. doi: 10.3748/wjg.v28.i6.653
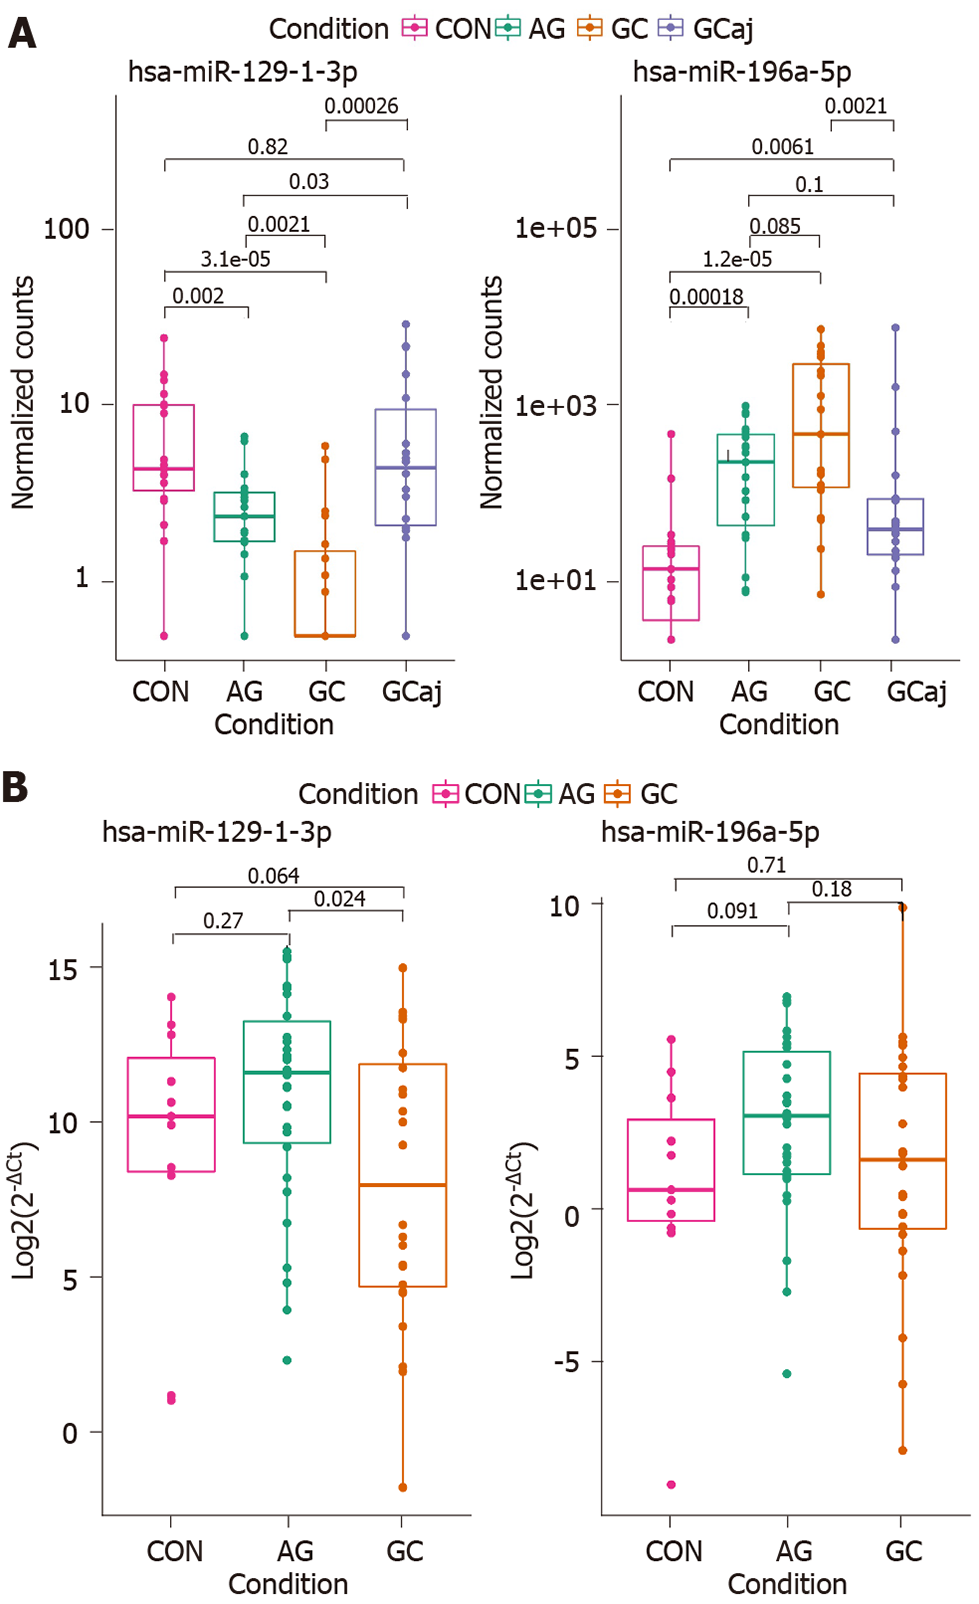
Figure 4 Hsa-miR-129-1-3p and hsa-miR-196a-5p expression levels in study comparison groups.
A: Atrophic gastritis and gastric cancer tissue samples compared to controls; B: Atrophic gastritis and gastric cancer plasma samples compared to controls. Box plot graphs; boxes correspond to the median value and interquartile range. CON: Control; AG: Atrophic gastritis; GC: Gastric cancerous; GCaj: Gastric adjacent tissue.
- Citation: Varkalaite G, Vaitkeviciute E, Inciuraite R, Salteniene V, Juzenas S, Petkevicius V, Gudaityte R, Mickevicius A, Link A, Kupcinskas L, Leja M, Kupcinskas J, Skieceviciene J. Atrophic gastritis and gastric cancer tissue miRNome analysis reveals hsa-miR-129-1 and hsa-miR-196a as potential early diagnostic biomarkers. World J Gastroenterol 2022; 28(6): 653-664
- URL: https://www.wjgnet.com/1007-9327/full/v28/i6/653.htm
- DOI: https://dx.doi.org/10.3748/wjg.v28.i6.653


