Copyright
©The Author(s) 2022.
World J Gastroenterol. Dec 21, 2022; 28(47): 6769-6787
Published online Dec 21, 2022. doi: 10.3748/wjg.v28.i47.6769
Published online Dec 21, 2022. doi: 10.3748/wjg.v28.i47.6769
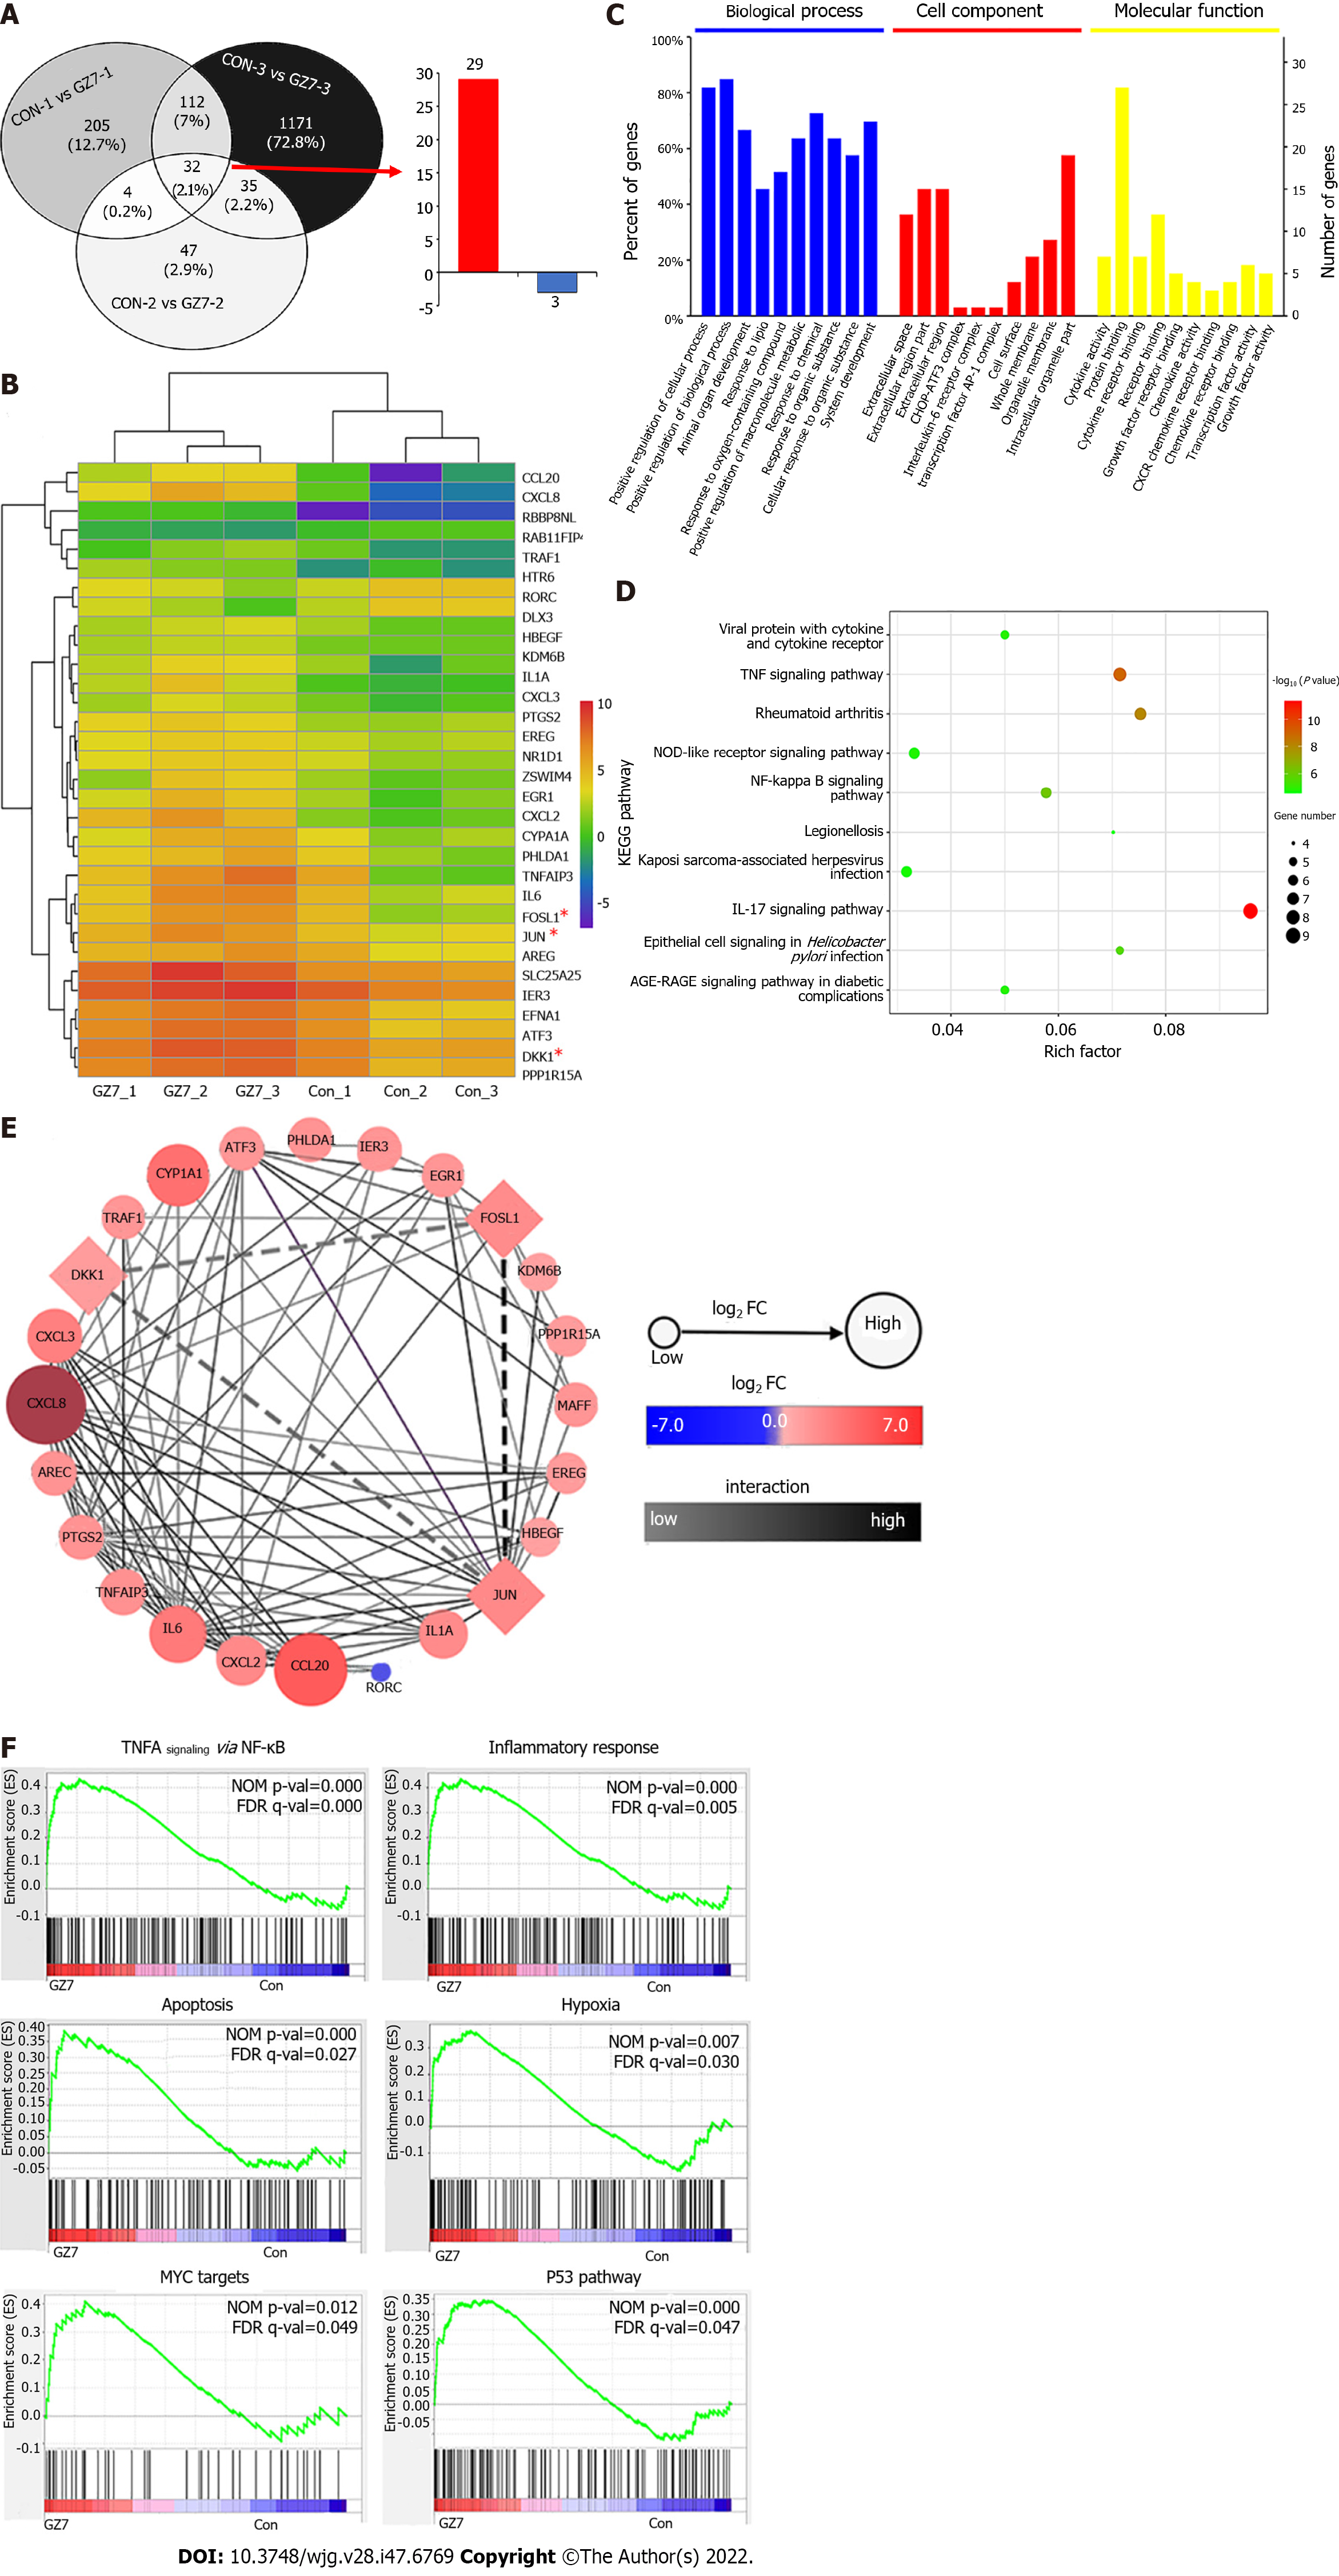
Figure 1 Comparison of differentially expressed genes between primary gastric cancer cells with and without Helicobacterpylori infection.
A: Venn diagram of differentially expressed genes (>DEGs); B: DEGs heatmap analysis by R heatmap package. Asterisks indicate the genes investigated in this study; C: Gene Ontology analysis of the DEGs; D: Kyoto Encyclopedia of Genes and Genomes pathway enrichment analysis of the DEGs; E: Protein-protein interaction network of the DEGs; F: Gene set enrichment analysis (GSEA) enrichment analyses of the DEGs with GSEA version 4.1.0. Con: Control; GZ7: Helicobacter pylori GZ7. TNF: Tumor necrosis factor; FOSL1: Fos-like antigen-1; DKK1: Dickkopf-related protein 1.
- Citation: Luo M, Chen YJ, Xie Y, Wang QR, Xiang YN, Long NY, Yang WX, Zhao Y, Zhou JJ. Dickkopf-related protein 1/cytoskeleton-associated protein 4 signaling activation by Helicobacter pylori-induced activator protein-1 promotes gastric tumorigenesis via the PI3K/AKT/mTOR pathway. World J Gastroenterol 2022; 28(47): 6769-6787
- URL: https://www.wjgnet.com/1007-9327/full/v28/i47/6769.htm
- DOI: https://dx.doi.org/10.3748/wjg.v28.i47.6769


