Copyright
©The Author(s) 2022.
World J Gastroenterol. Dec 14, 2022; 28(46): 6522-6536
Published online Dec 14, 2022. doi: 10.3748/wjg.v28.i46.6522
Published online Dec 14, 2022. doi: 10.3748/wjg.v28.i46.6522
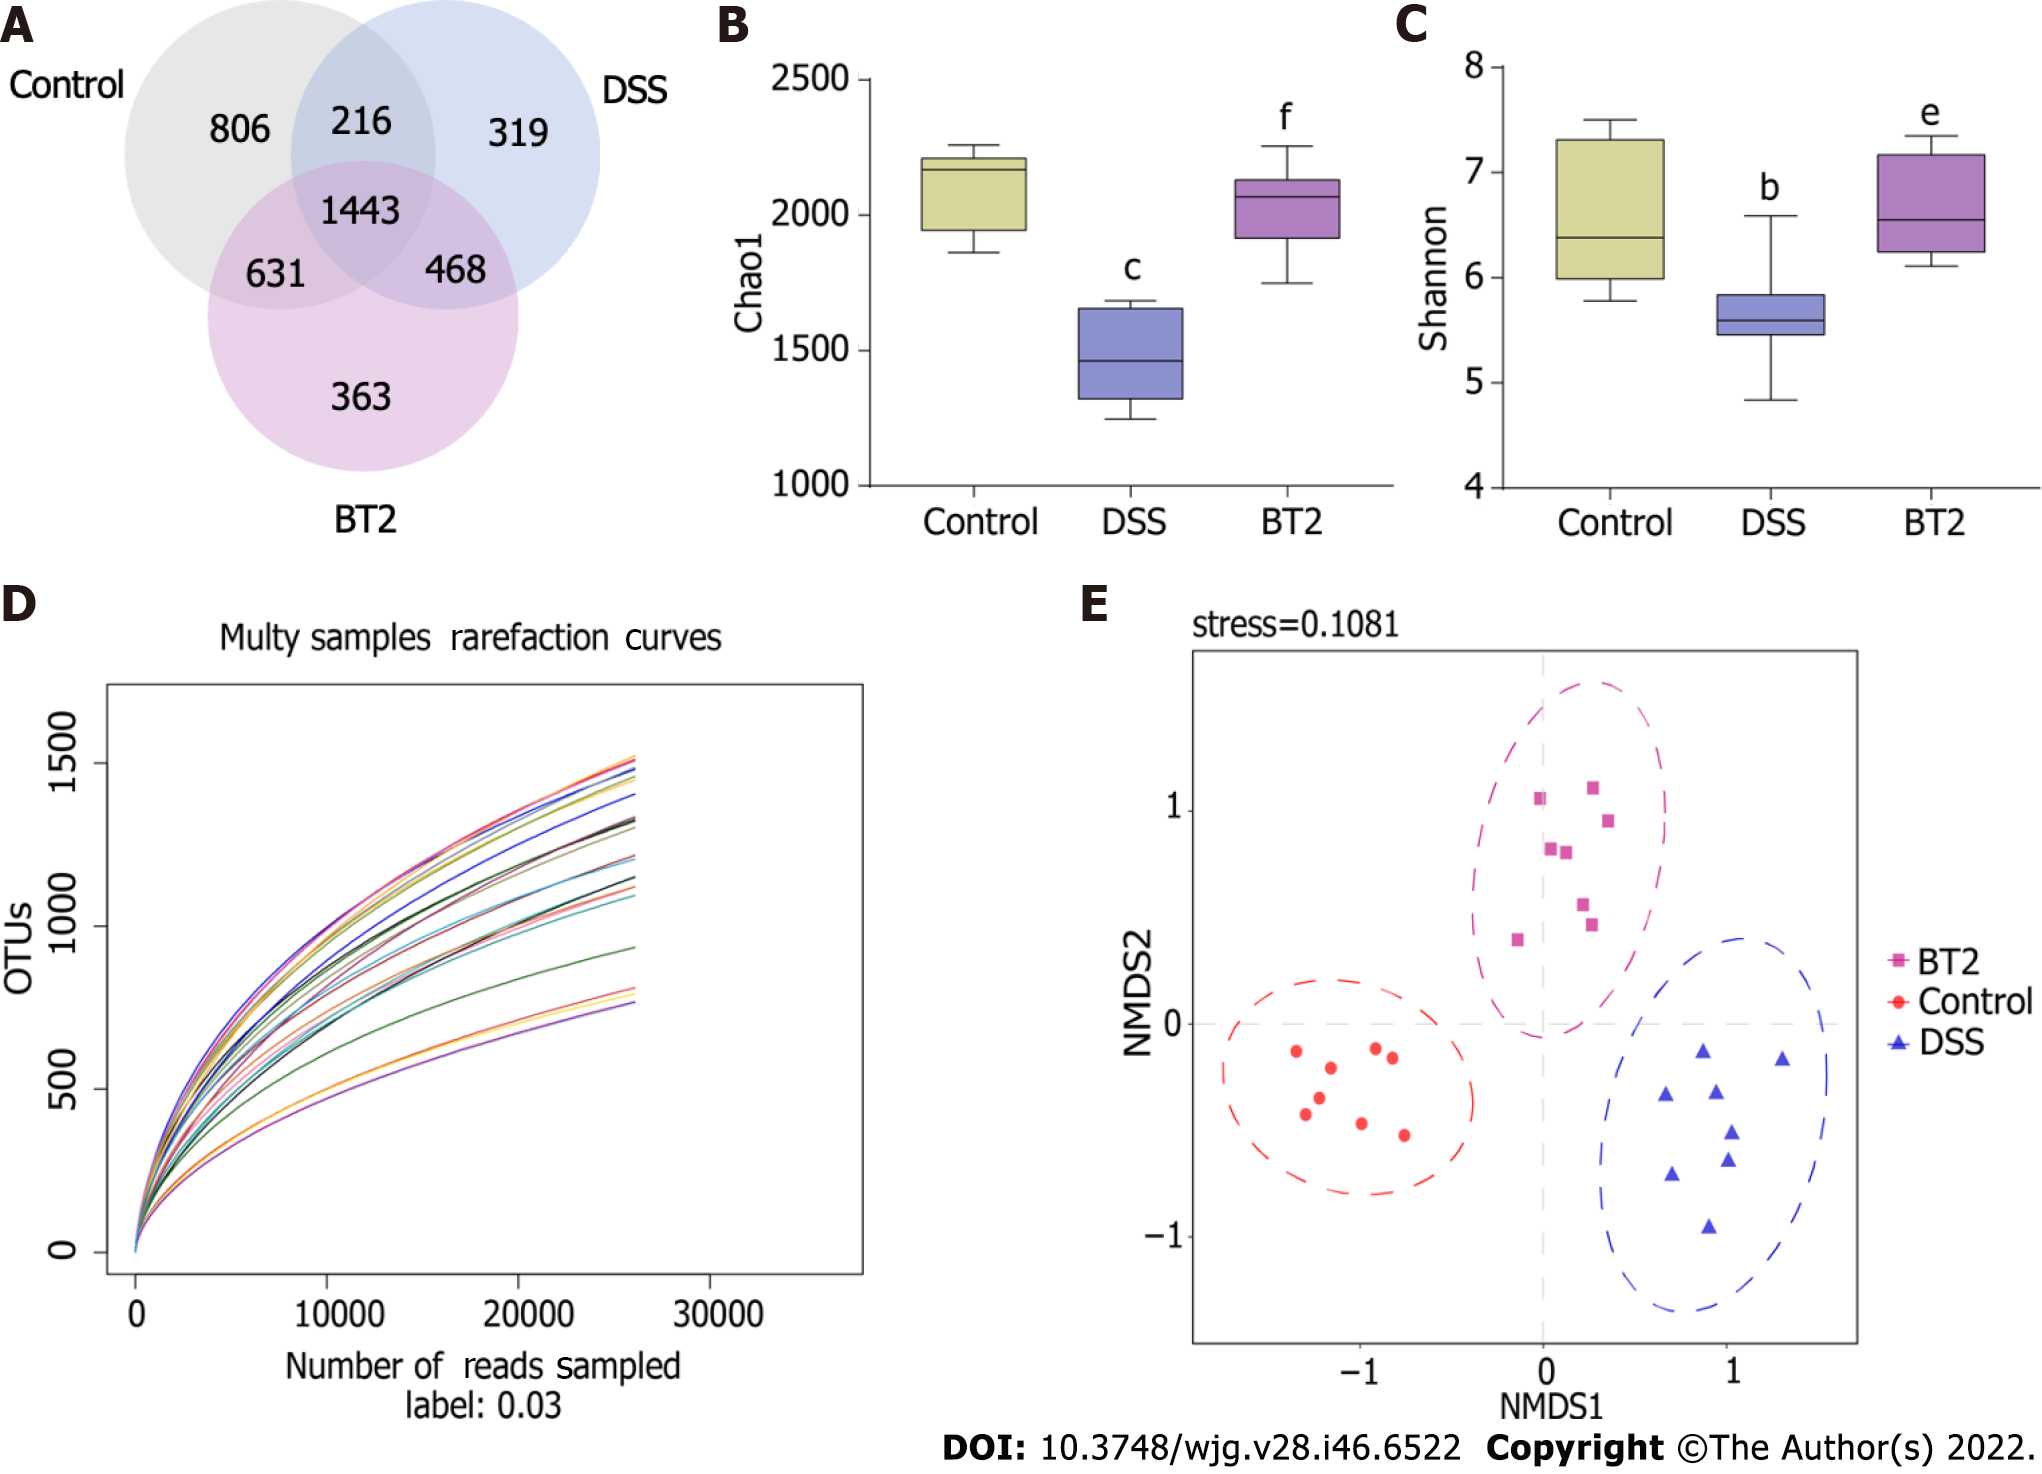
Figure 6 Effects of 3,6-dichlorobenzo[b]thiophene-2-carboxylic acid treatment on the overall structure of gut microbiota.
A: The Venn diagram depicts the overlap of operational taxonomic units in each group; B: Chao1 index from fecal samples; C: Shannon index from fecal samples; D: The dilution curve indicates the rationality of the amount of sequencing data; E: Nonmetric multidimensional scaling analysis plot of fecal microbiota of each group. eP < 0.01 and
- Citation: He QZ, Wei P, Zhang JZ, Liu TT, Shi KQ, Liu HH, Zhang JW, Liu SJ. 3,6-dichlorobenzo[b]thiophene-2-carboxylic acid alleviates ulcerative colitis by suppressing mammalian target of rapamycin complex 1 activation and regulating intestinal microbiota. World J Gastroenterol 2022; 28(46): 6522-6536
- URL: https://www.wjgnet.com/1007-9327/full/v28/i46/6522.htm
- DOI: https://dx.doi.org/10.3748/wjg.v28.i46.6522


