Copyright
©The Author(s) 2022.
World J Gastroenterol. Nov 21, 2022; 28(43): 6131-6156
Published online Nov 21, 2022. doi: 10.3748/wjg.v28.i43.6131
Published online Nov 21, 2022. doi: 10.3748/wjg.v28.i43.6131
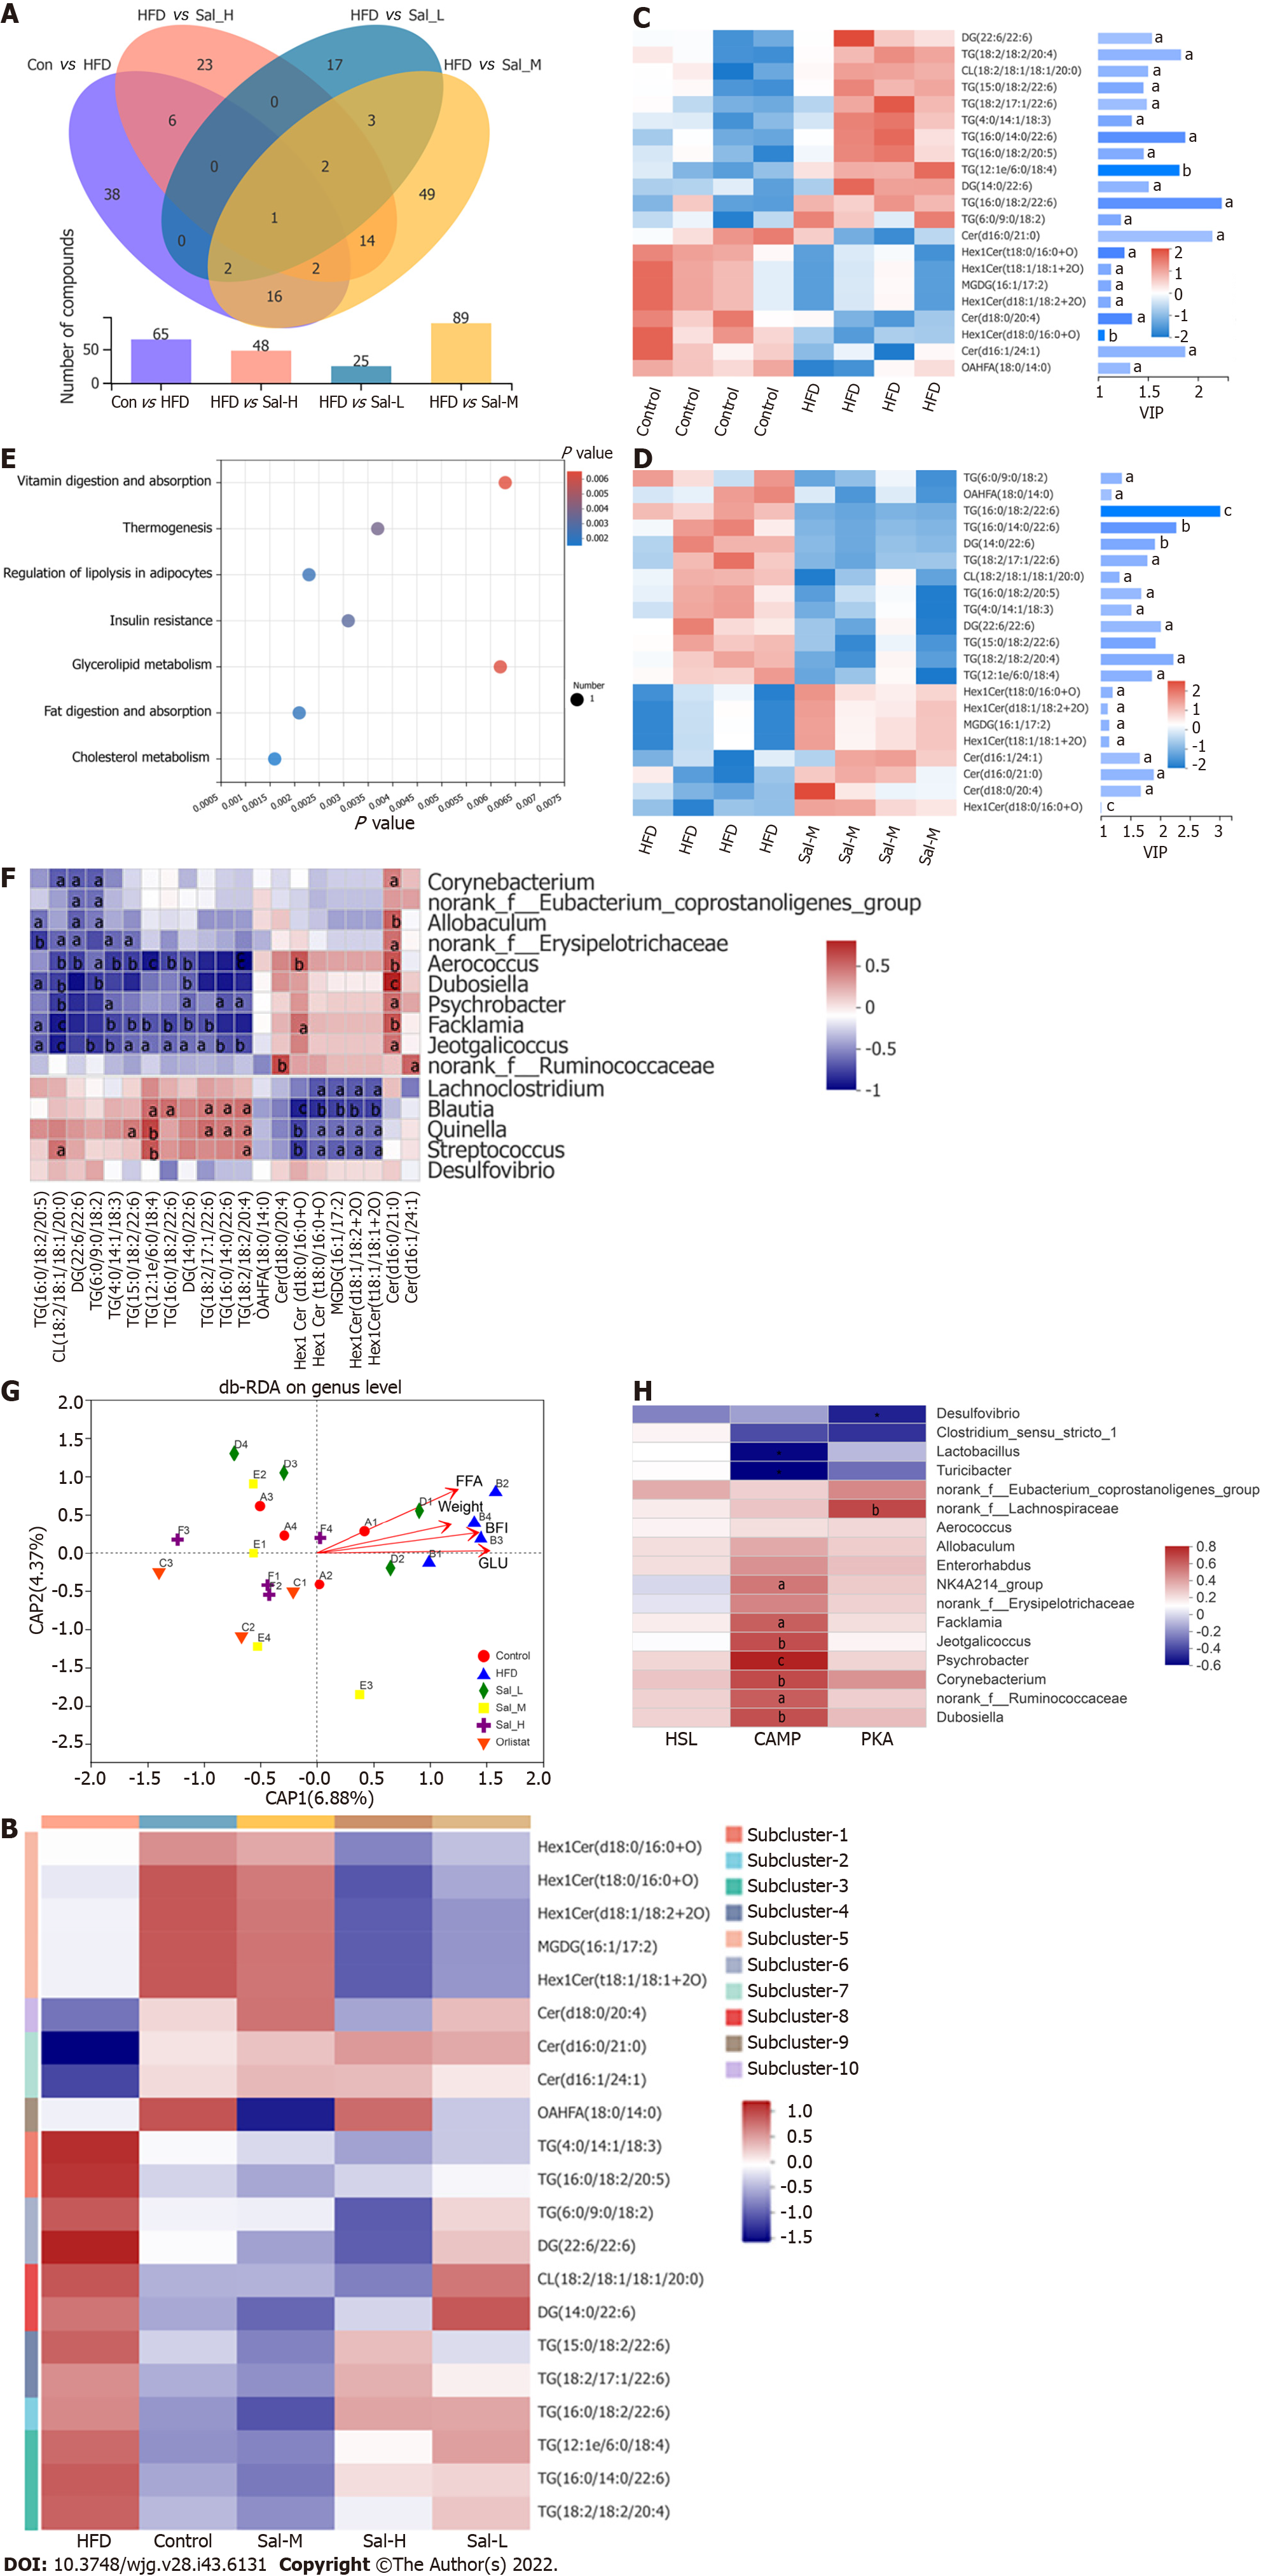
Figure 8 Lipidomics analysis and associations of gut microbial species with environmental factors.
A: Numbers of differential metabolites between the control and high-fat diet (HFD) groups, HFD and Sal_L groups, HFD and Sal_M groups, and HFD and Sal_H groups (Venn diagram); B: Hierarchical clustering of metabolites in Control, HFD, Sal_L, Sal_M, and Sal_H groups; C: Heatmap of the VIP expression profile of the metabolites between control and HFD groups; D: Heatmap of the VIP expression profile of the metabolites between HFD and Sal_M groups; E: KEGG pathway enrichment; F: Spearman’s correlation between metabolites and gut microbiota; G: Correlation between free fatty acids, weight, body fat index, glucose, and microbial flora structure displayed by distance-based redundancy analysis (db-RDA analysis); H: Spearman’s correlation between cAMP, PKA, HSL, and gut microbiota. aP < 0.05, bP < 0.01, or cP < 0.001.
- Citation: Ai ZL, Zhang X, Ge W, Zhong YB, Wang HY, Zuo ZY, Liu DY. Salvia miltiorrhiza extract may exert an anti-obesity effect in rats with high-fat diet-induced obesity by modulating gut microbiome and lipid metabolism. World J Gastroenterol 2022; 28(43): 6131-6156
- URL: https://www.wjgnet.com/1007-9327/full/v28/i43/6131.htm
- DOI: https://dx.doi.org/10.3748/wjg.v28.i43.6131


