Copyright
©The Author(s) 2022.
World J Gastroenterol. Nov 21, 2022; 28(43): 6109-6130
Published online Nov 21, 2022. doi: 10.3748/wjg.v28.i43.6109
Published online Nov 21, 2022. doi: 10.3748/wjg.v28.i43.6109
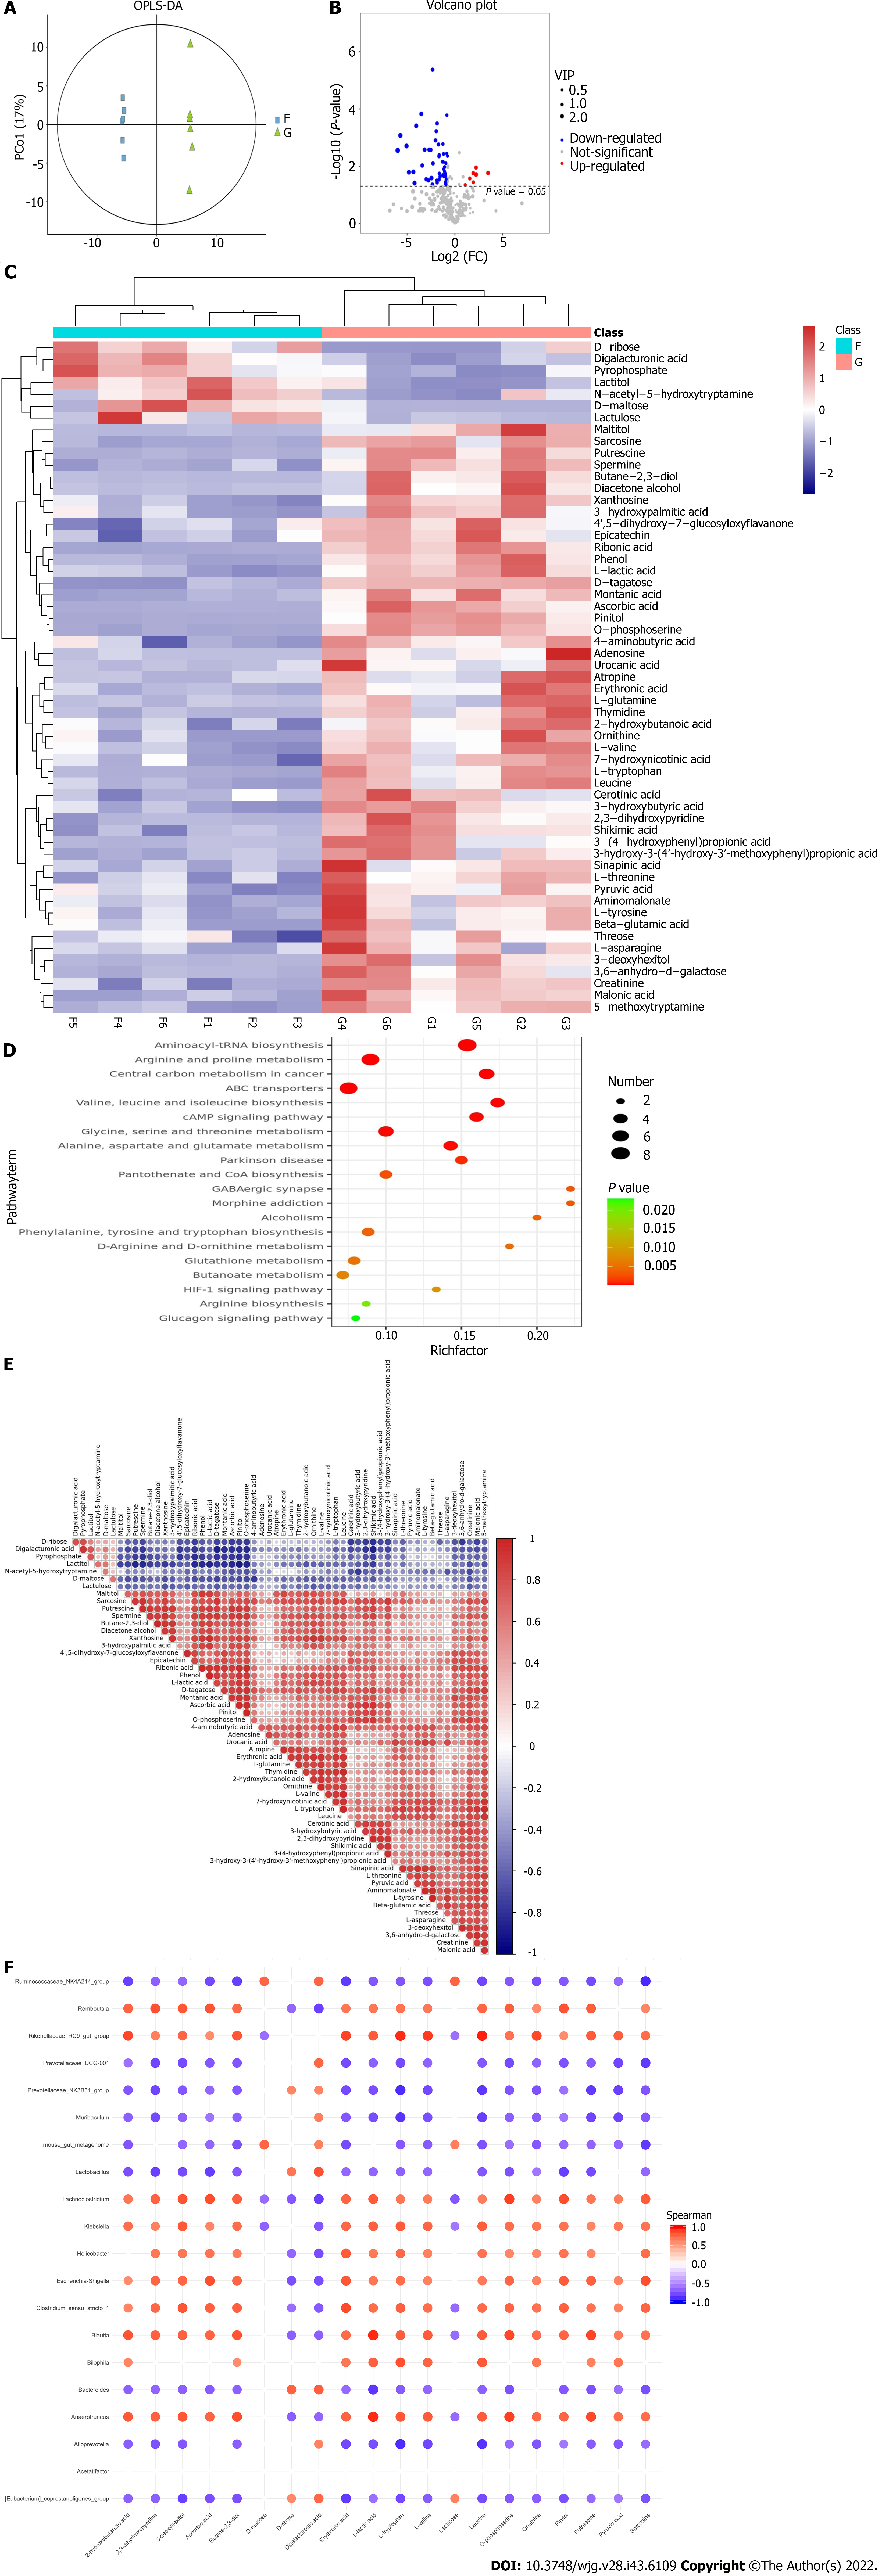
Figure 6 Analysis of different microbiota metabolites in dextran sulfate sodium-induced colitis mice.
A: Orthogonal partial least-squares discrimination analysis; B: Metabolite volcano plot; C: Clustered heat map of significantly expressed metabolites; D: Bubble mapping of the top 20 significant Kyoto Encyclopedia of Genes and Genomes pathways of metabolites; E: Correlation matrix analysis with significant metabolites; F: Correlation matrix of the top 20 differential metabolites and the microbiota at the genus levels. F: Blank group; G: Microbiota+ colitis group.
- Citation: Wang JL, Han X, Li JX, Shi R, Liu LL, Wang K, Liao YT, Jiang H, Zhang Y, Hu JC, Zhang LM, Shi L. Differential analysis of intestinal microbiota and metabolites in mice with dextran sulfate sodium-induced colitis. World J Gastroenterol 2022; 28(43): 6109-6130
- URL: https://www.wjgnet.com/1007-9327/full/v28/i43/6109.htm
- DOI: https://dx.doi.org/10.3748/wjg.v28.i43.6109


