Copyright
©The Author(s) 2022.
World J Gastroenterol. Nov 21, 2022; 28(43): 6109-6130
Published online Nov 21, 2022. doi: 10.3748/wjg.v28.i43.6109
Published online Nov 21, 2022. doi: 10.3748/wjg.v28.i43.6109
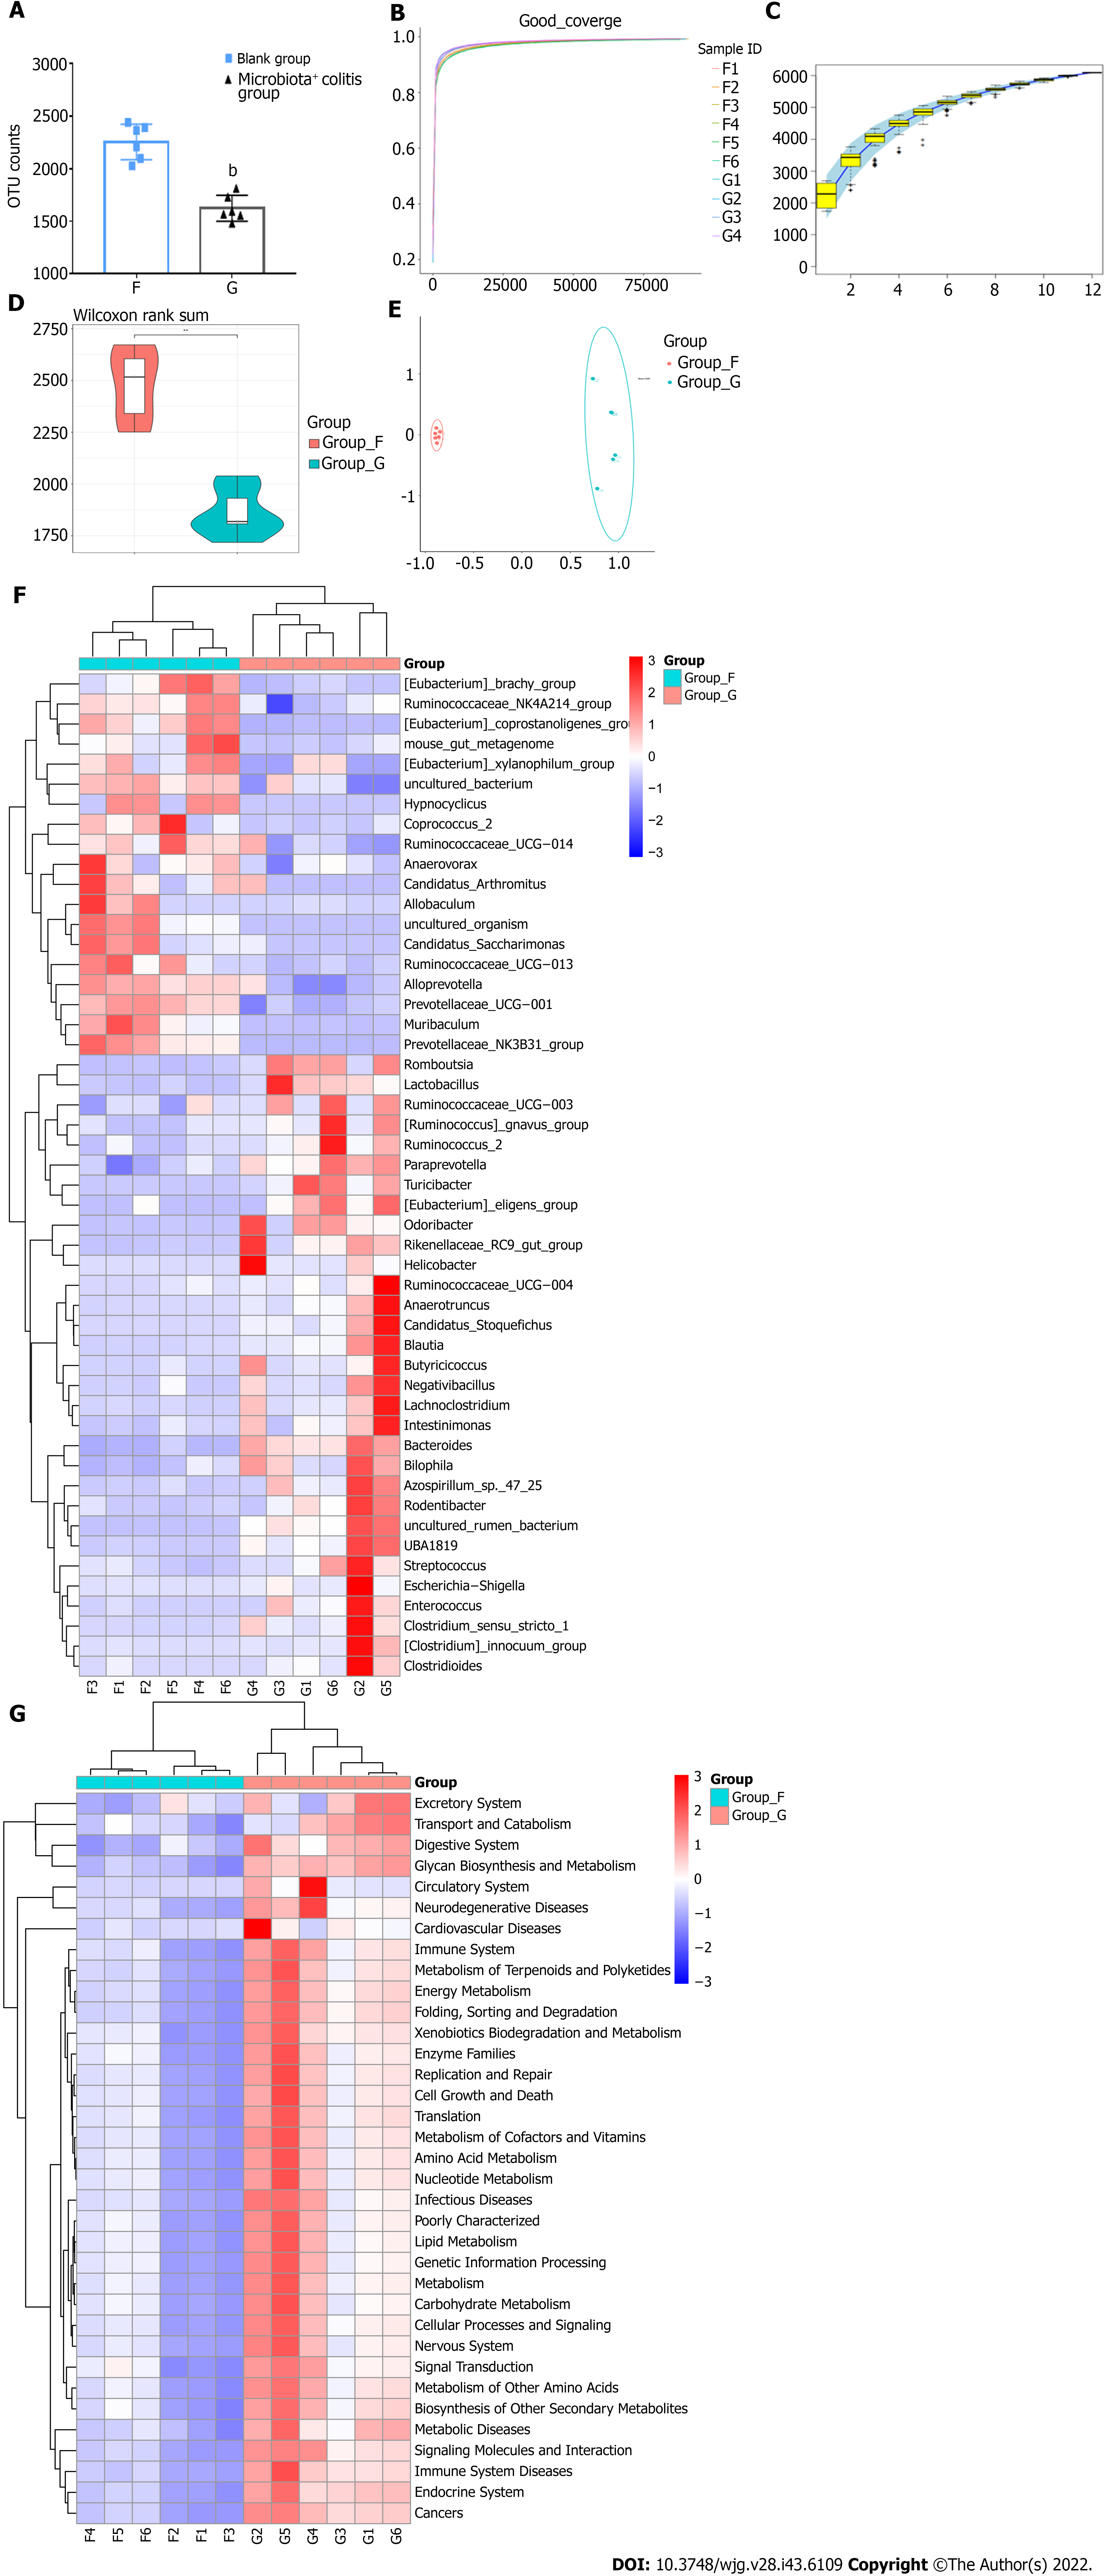
Figure 5 Analysis of different characteristic microbiota in dextran sulfate sodium-induced colitis mice.
A: Operational taxonomic unit counts; B: Goods coverage index dilution curve; C: Specaccum species accumulation curve; D: Observed species violin graph of alpha-diversity; E: Beta-diversity; F: Heat map cluster analysis of 50 different species at the genus level; G: Heat map cluster analysis of Phylogenetic Investigation of Communities by Reconstruction of Unobserved States analysis with Kyoto Encyclopedia of Genes and Genomes pathways at the phylum level. F: Blank group; G: Microbiota+ colitis group. Compared with the blank group, bP < 0.01.
- Citation: Wang JL, Han X, Li JX, Shi R, Liu LL, Wang K, Liao YT, Jiang H, Zhang Y, Hu JC, Zhang LM, Shi L. Differential analysis of intestinal microbiota and metabolites in mice with dextran sulfate sodium-induced colitis. World J Gastroenterol 2022; 28(43): 6109-6130
- URL: https://www.wjgnet.com/1007-9327/full/v28/i43/6109.htm
- DOI: https://dx.doi.org/10.3748/wjg.v28.i43.6109


