Copyright
©The Author(s) 2022.
World J Gastroenterol. Jan 28, 2022; 28(4): 479-496
Published online Jan 28, 2022. doi: 10.3748/wjg.v28.i4.479
Published online Jan 28, 2022. doi: 10.3748/wjg.v28.i4.479
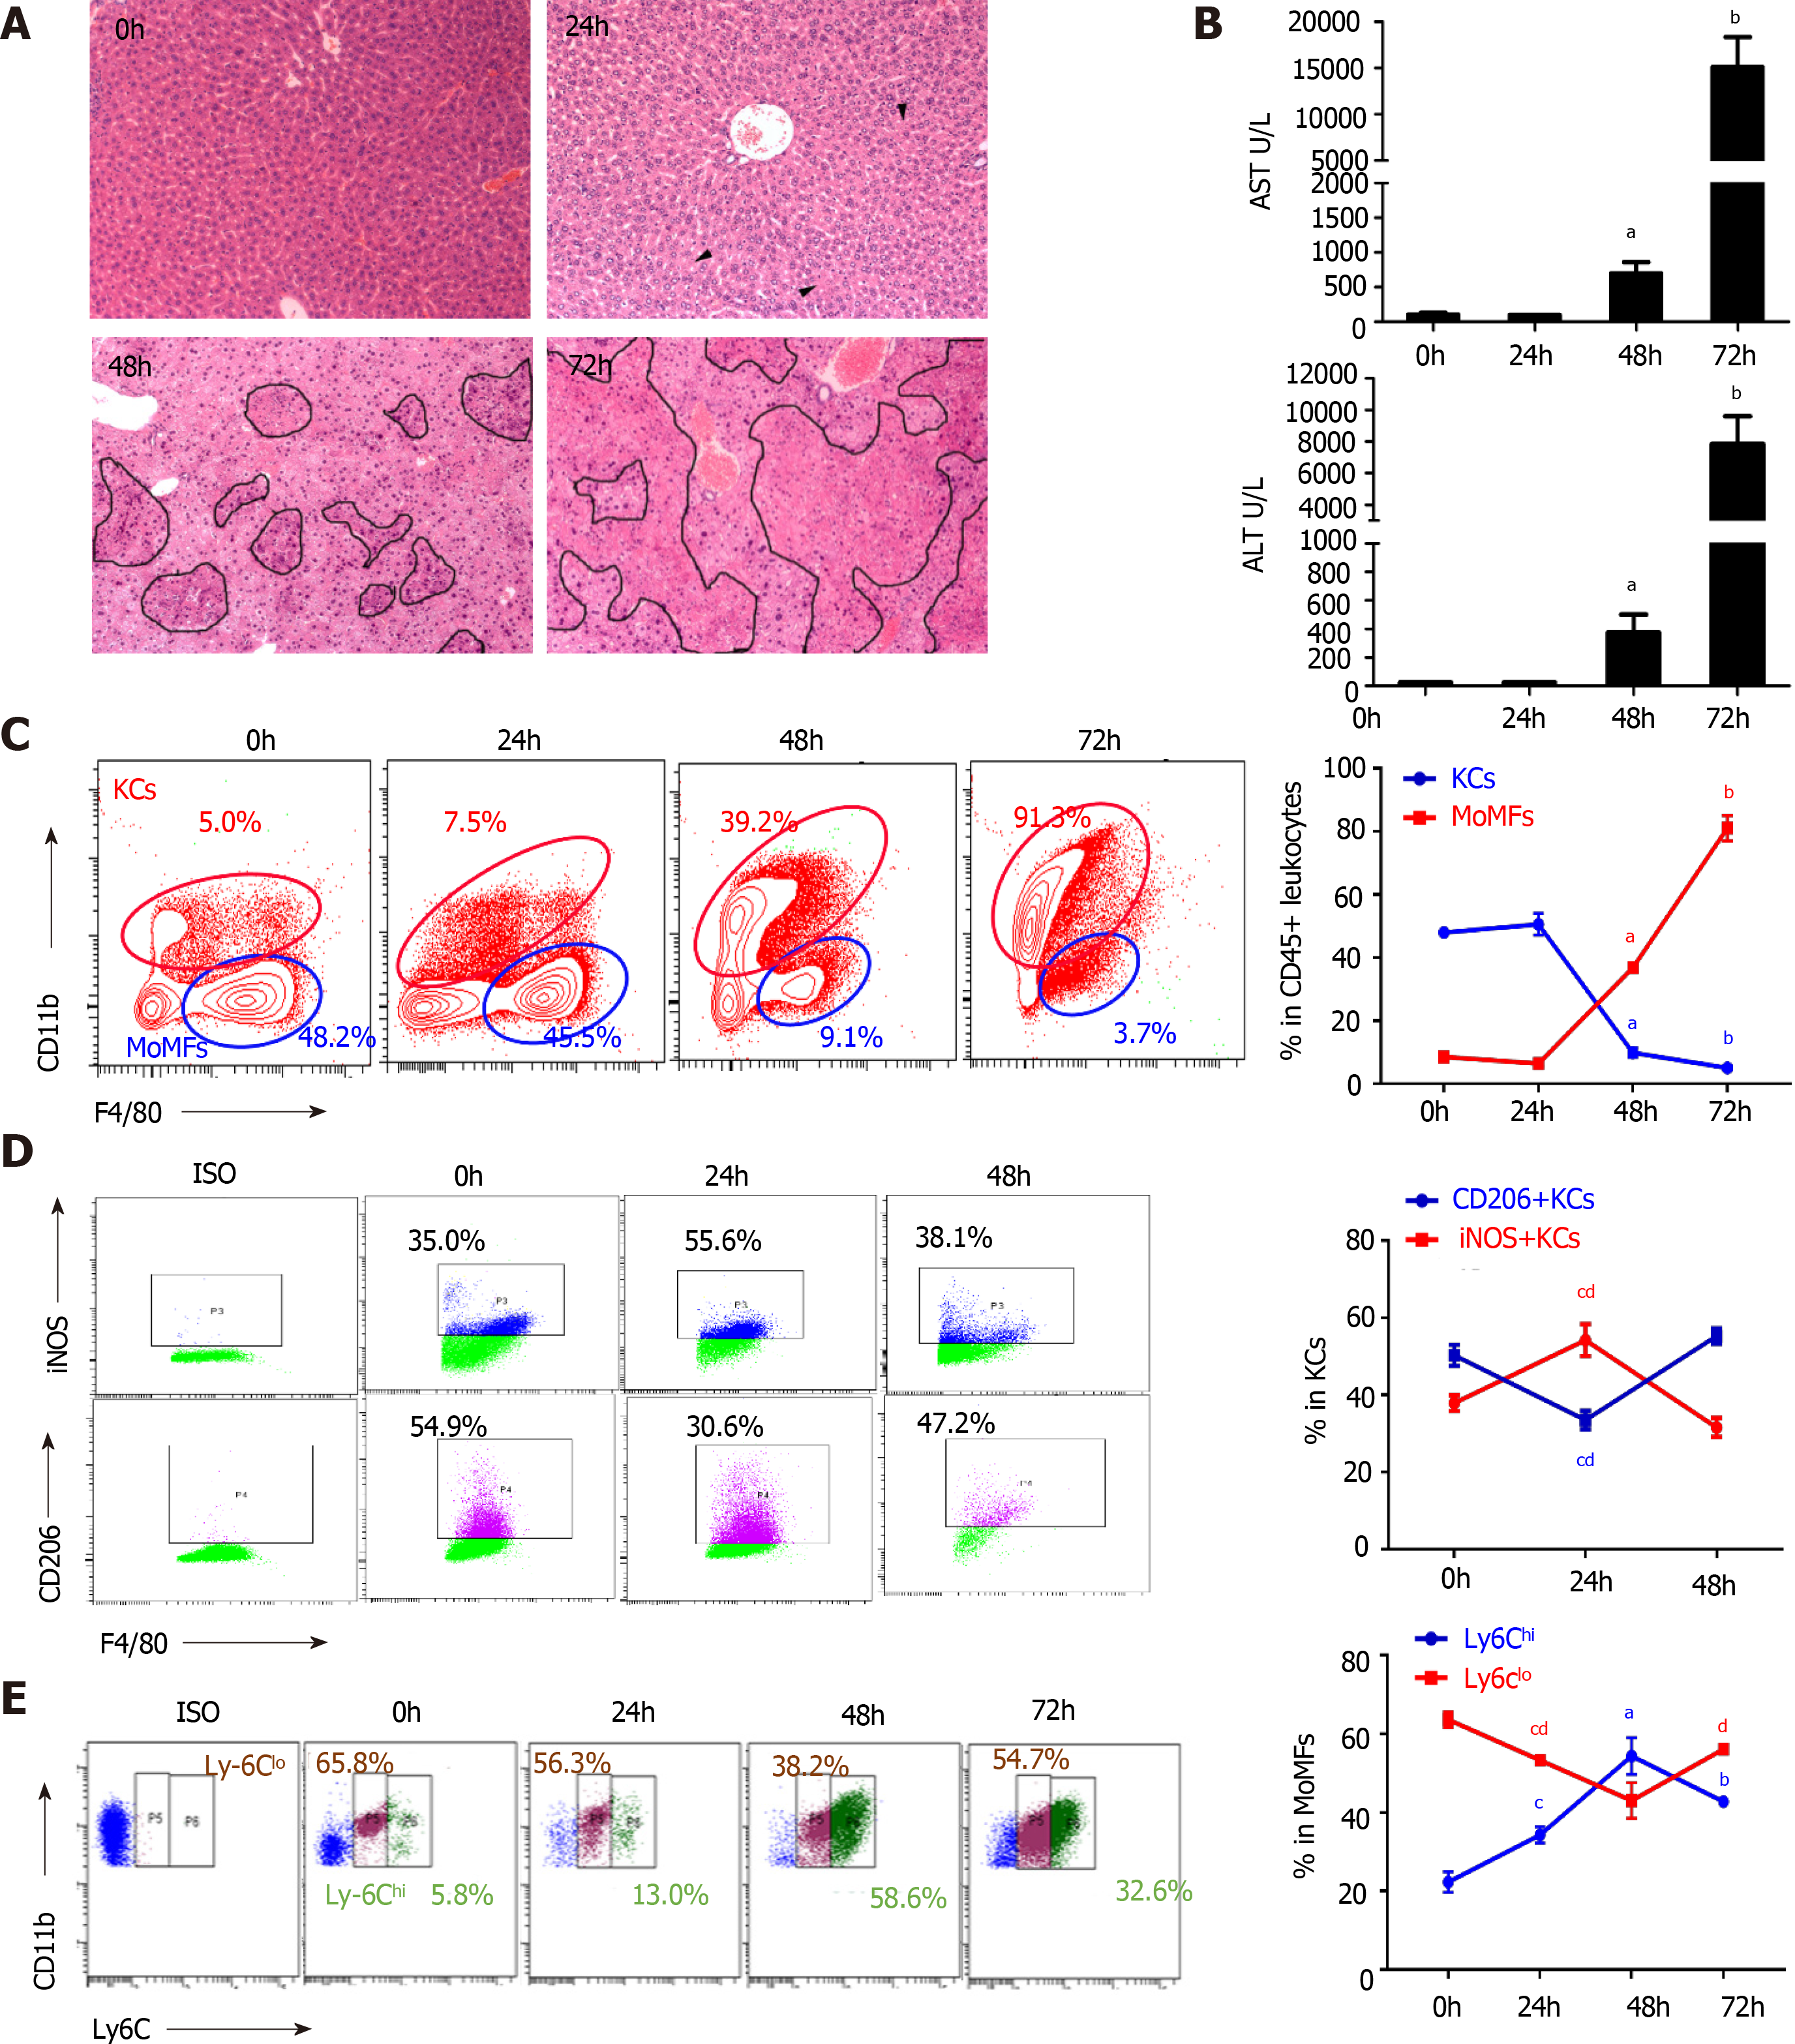
Figure 2 Dynamic alteration of macrophage subsets during viral fulminant hepatitis progression.
A: Time-course H&E staining on liver sections of mice after murine hepatitis virus strain 3 infection. Arrowheads indicated hepatocyte cytoplasmic destruction, Circles pointed to necrosis; B: ALT and AST levels from serum of mice post-viral infection; C: Flow cytometry of KCs (CD45+ F4/80high), MoMFs (CD45+ Ly6C+ F4/80int) of cells (left), and their percentage in the liver at various time point after viral infection; D: Flow cytometry of KCs (left) and frequency of M1 (iNOS+), M2 (CD206+) macrophages in KCs (right); E: Representative image of MoMFs (left) and frequency of Ly6Chigh and Ly6Clow MoMFs at different time point after viral infection. Data are presented as mean ± SD (n = 5). These experiments were repeated at least three times. KCs: Kuffer cells; MoMFs: Monocyte derived macrophages.
- Citation: Xiao F, Wang HW, Hu JJ, Tao R, Weng XX, Wang P, Wu D, Wang XJ, Yan WM, Xi D, Luo XP, Wan XY, Ning Q. Fibrinogen-like protein 2 deficiency inhibits virus-induced fulminant hepatitis through abrogating inflammatory macrophage activation. World J Gastroenterol 2022; 28(4): 479-496
- URL: https://www.wjgnet.com/1007-9327/full/v28/i4/479.htm
- DOI: https://dx.doi.org/10.3748/wjg.v28.i4.479


