Copyright
©The Author(s) 2022.
World J Gastroenterol. Oct 21, 2022; 28(39): 5764-5783
Published online Oct 21, 2022. doi: 10.3748/wjg.v28.i39.5764
Published online Oct 21, 2022. doi: 10.3748/wjg.v28.i39.5764
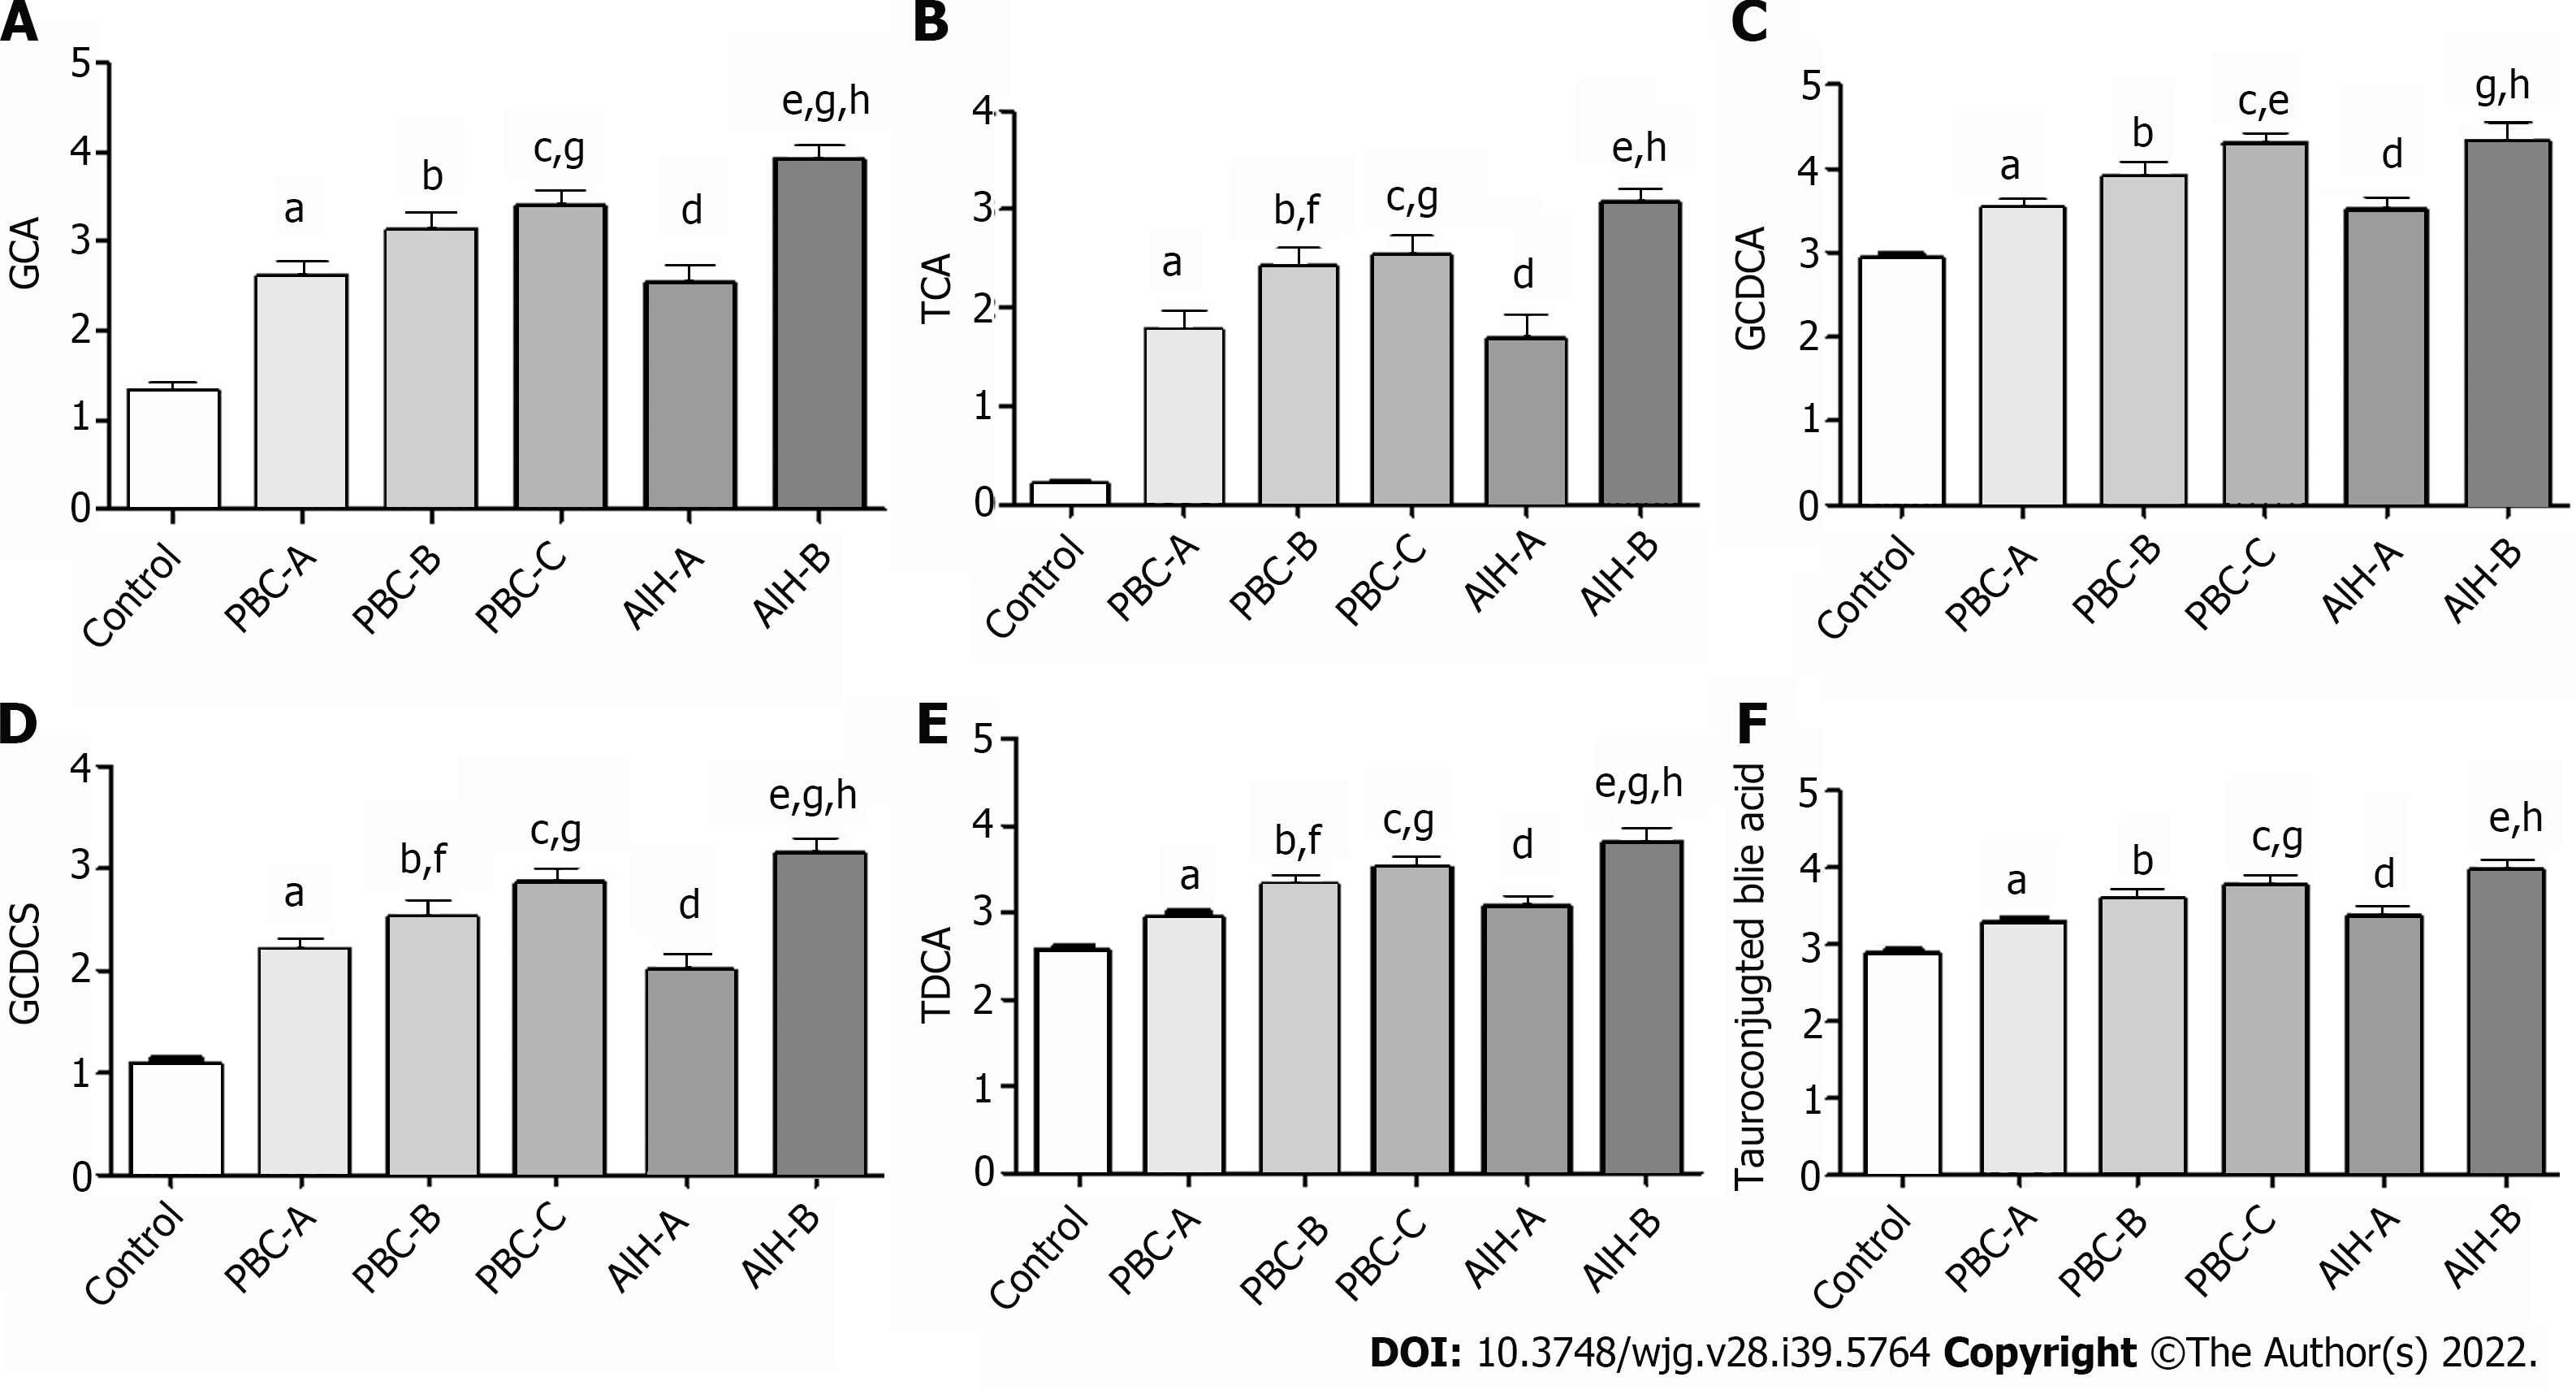
Figure 10 Bile acid levels are expressed in log10 concentrations.
Statistically significant differences in bile acid concentrations between controls and patients were determined by the rank sums Mann-Whitney test. Primary biliary cholangitis (PBC)-A vs control, aP < 0.05; PBC-B vs control, bP < 0.05; PBC-C vs control, cP < 0.05; autoimmune hepatitis (AIH)-A vs control, dP < 0.05; AIH-B vs control, eP < 0.05; PBC-A vs PBC-B, fP < 0.05; PBC-A vs PBC-C, gP < 0.05; AIH-A vs AIH-B, hP < 0.05; PBC-A vs AIH-A. A: Glycocholic acid; B: Taurocholic acid; C: Glycochenodeoxycholic acid; D: Glycochenodeoxycholic sulfate; E: Taurodeoxycholic acid; F: Tauroconjugted bile acid. GCDCA: Glycochenodeoxycholic acid; GCDCS: Glycochenodeoxycholic sulfate; TDCA: Taurodeoxycholic acid; GCA: Glycocholic acid; TCA: Taurocholic acid.
- Citation: Ma ZH, Wang XM, Wu RH, Hao DL, Sun LC, Li P, Niu JQ. Serum metabolic profiling of targeted bile acids reveals potentially novel biomarkers for primary biliary cholangitis and autoimmune hepatitis. World J Gastroenterol 2022; 28(39): 5764-5783
- URL: https://www.wjgnet.com/1007-9327/full/v28/i39/5764.htm
- DOI: https://dx.doi.org/10.3748/wjg.v28.i39.5764


