Copyright
©The Author(s) 2022.
World J Gastroenterol. Oct 14, 2022; 28(38): 5614-5625
Published online Oct 14, 2022. doi: 10.3748/wjg.v28.i38.5614
Published online Oct 14, 2022. doi: 10.3748/wjg.v28.i38.5614
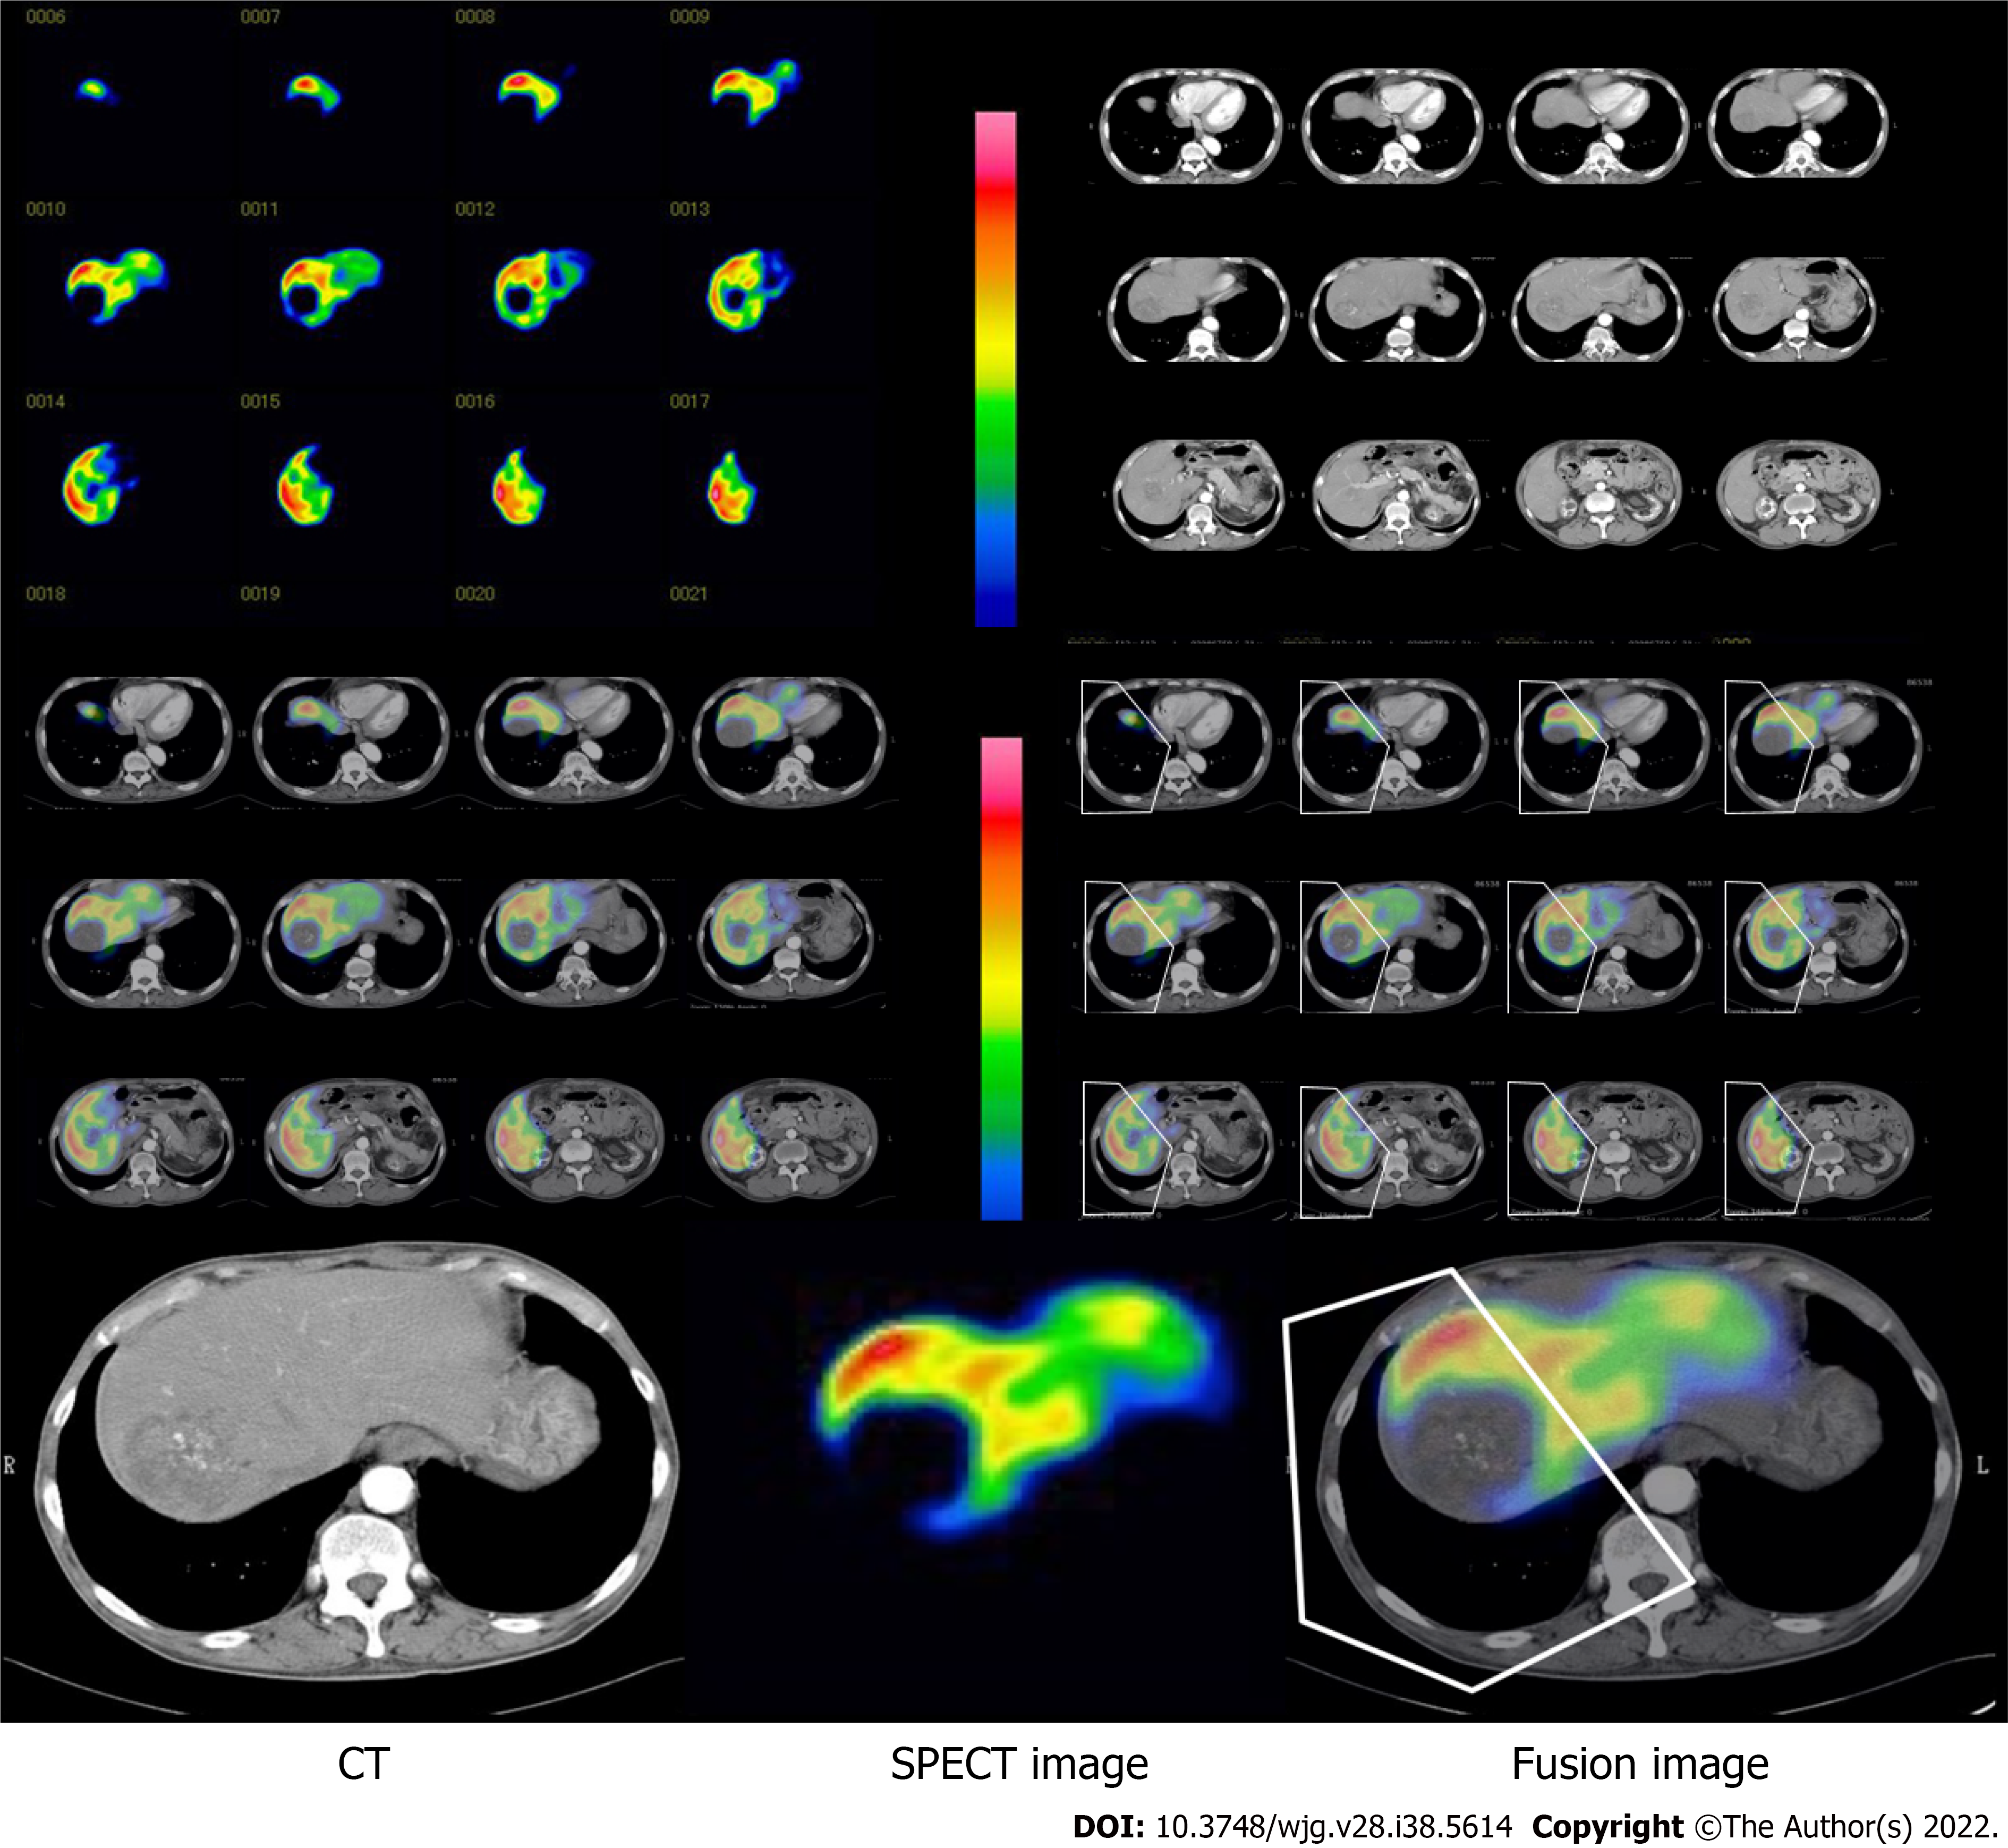
Figure 1 Schematic model for analysis of regional hepatic clearance with computed tomography fusion images.
The images of 99mTc-galactosyl serum albumin scintigraphy single photon emission computed tomography and computed tomography scans were merged using software. The cutting line was set based on tumor location and size on each fusion image. The liver function was calculated automatically as 99mTc-galactosyl serum albumin scintigraphy parameters. CT: Computed tomography; SPECT: Single photon emission computed tomography.
- Citation: Miki A, Sakuma Y, Ohzawa H, Saito A, Meguro Y, Watanabe J, Morishima K, Endo K, Sasanuma H, Shimizu A, Lefor AK, Yasuda Y, Sata N. Clearance of the liver remnant predicts short-term outcome in patients undergoing resection of hepatocellular carcinoma. World J Gastroenterol 2022; 28(38): 5614-5625
- URL: https://www.wjgnet.com/1007-9327/full/v28/i38/5614.htm
- DOI: https://dx.doi.org/10.3748/wjg.v28.i38.5614


