Copyright
©The Author(s) 2022.
World J Gastroenterol. Oct 14, 2022; 28(38): 5573-5588
Published online Oct 14, 2022. doi: 10.3748/wjg.v28.i38.5573
Published online Oct 14, 2022. doi: 10.3748/wjg.v28.i38.5573
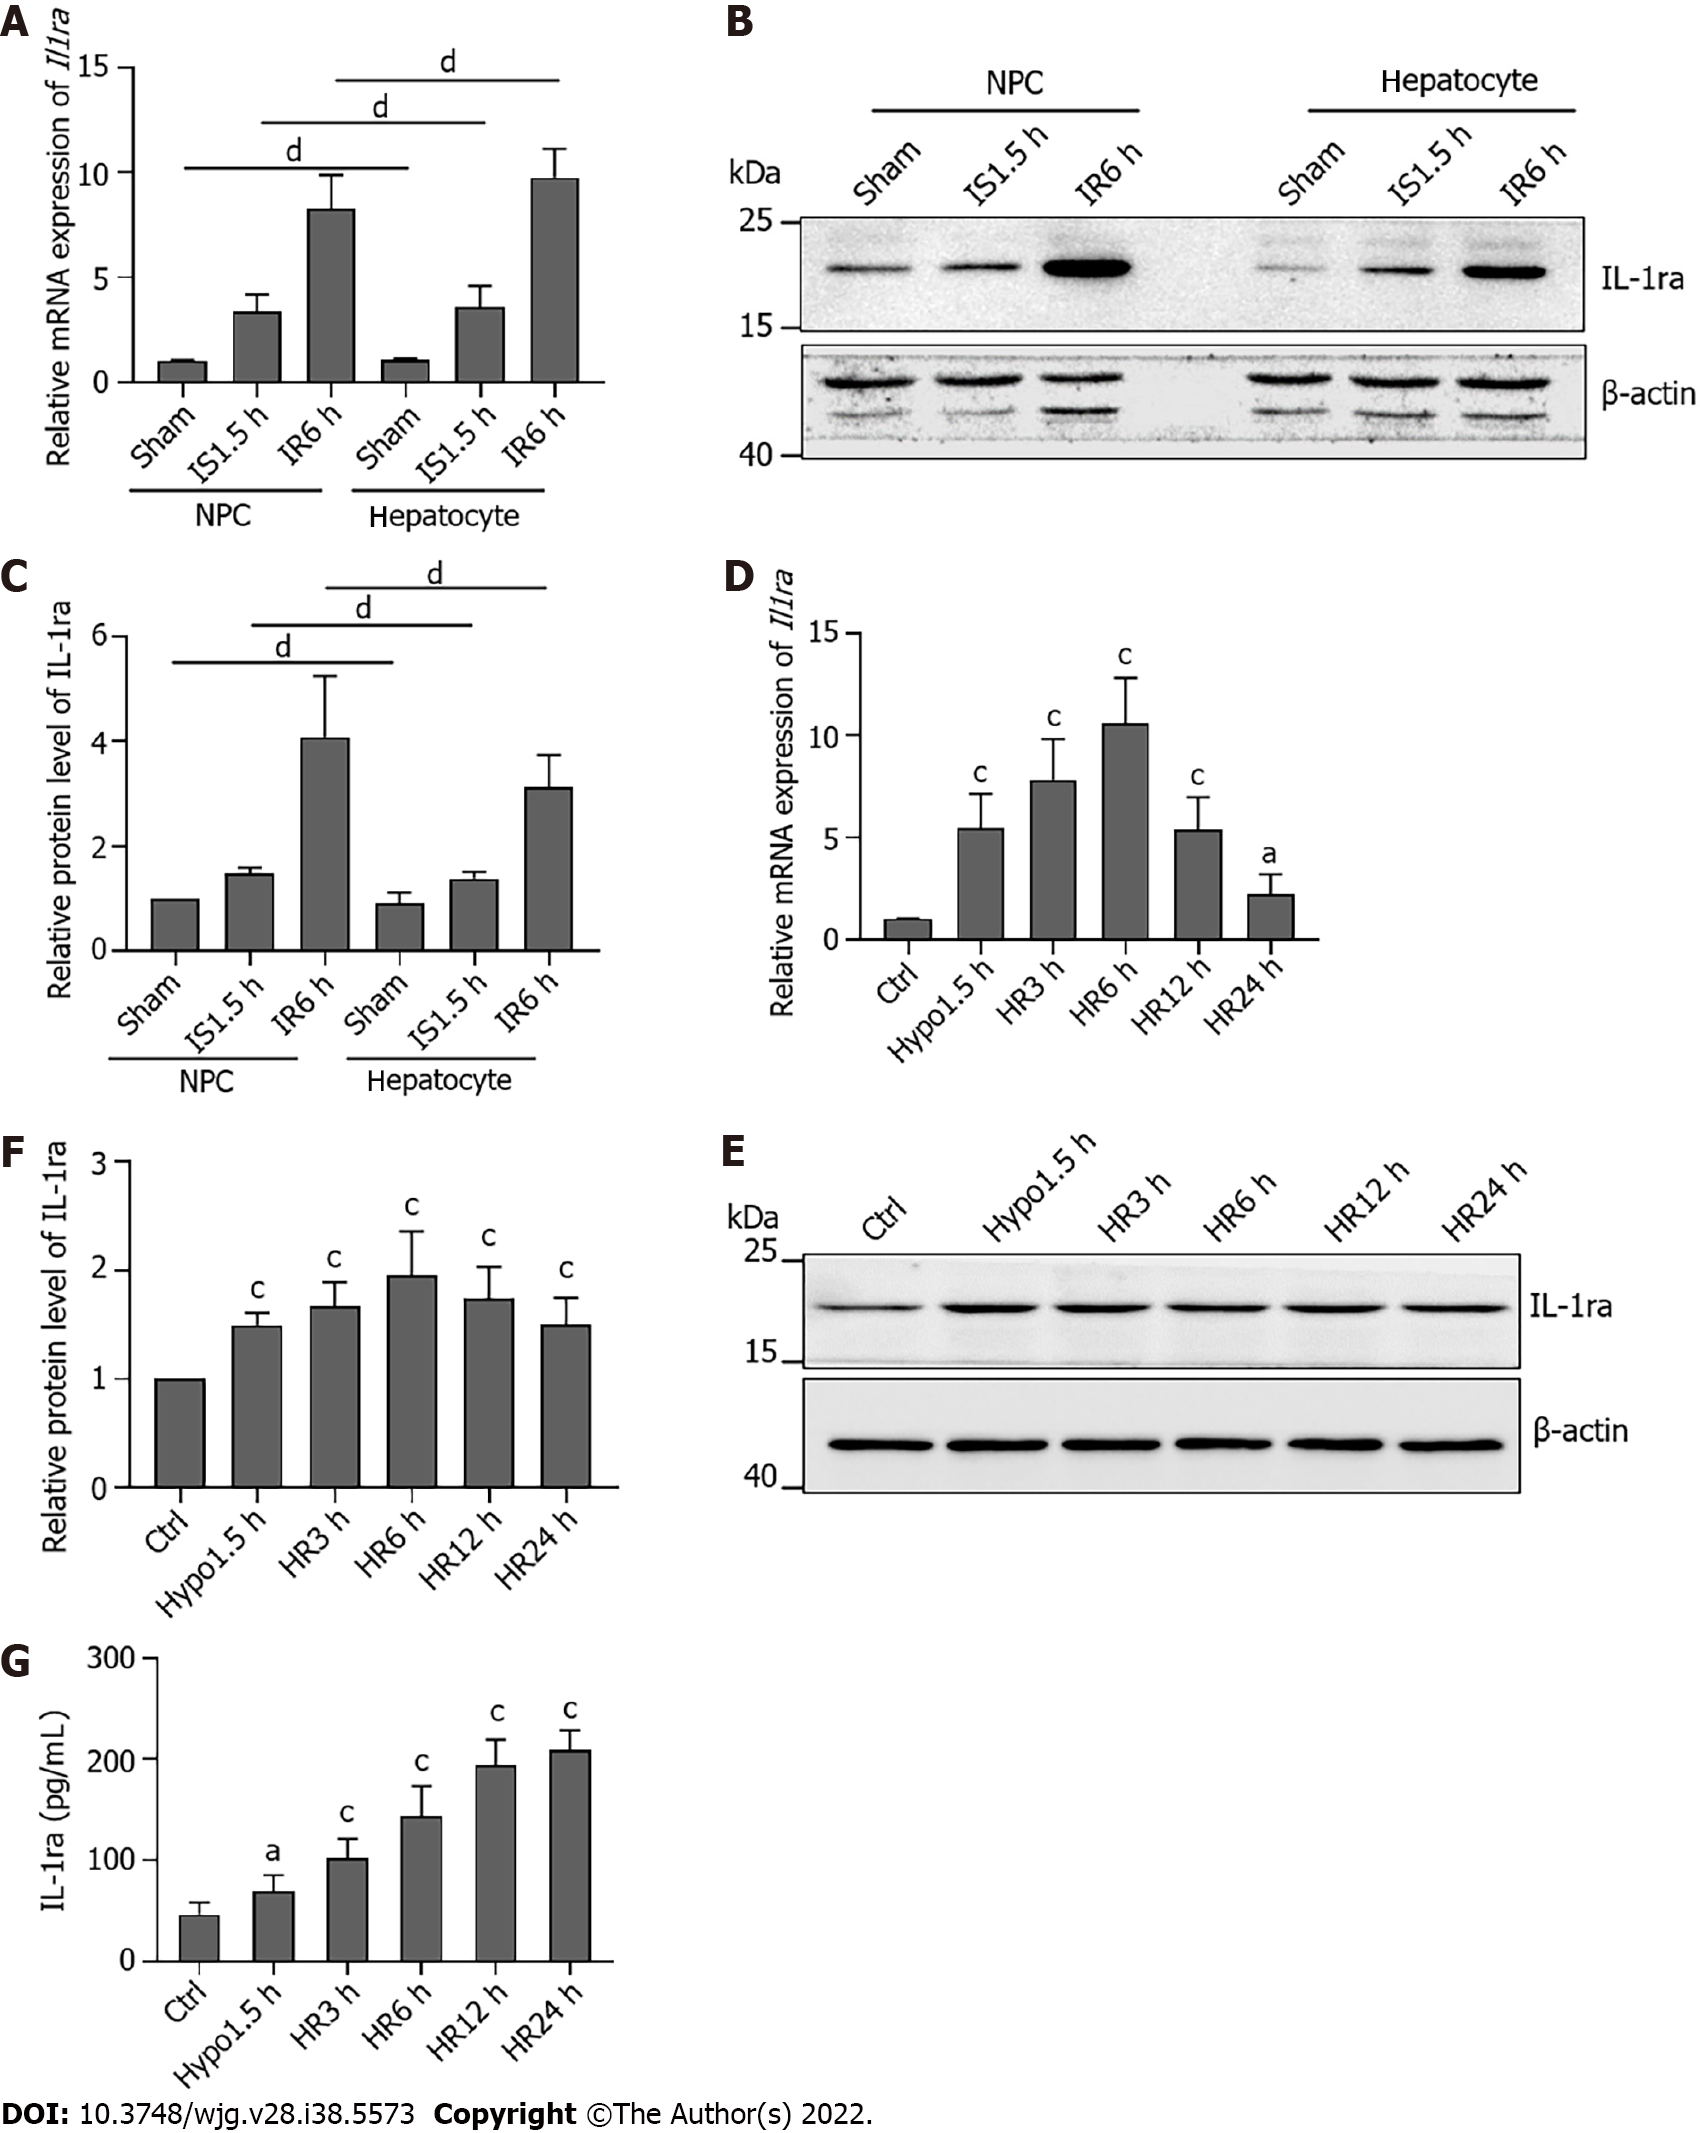
Figure 3 Interleukin-1 receptor antagonist is expressed in both mouse hepatocytes and nonparenchymal cells.
A: Relative mRNA levels of interleukin-1 receptor antagonist (Il1ra) in hepatocytes and nonparenchymal cells (NPCs) after ischemia-reperfusion injury (IRI); B: Protein levels of IL-1ra in hepatocytes and NPCs after IRI; C: Statistical analysis of protein levels of IL-1Ra in hepatocytes and NPCs after IRI; D: Relative mRNA levels of Il1ra in AML12 cells upon hypoxia-reoxygenation (HR); E: Protein levels of IL-1ra in AML12 cells upon HR; F: Statistical analysis of protein levels of IL-1Ra in AML12 cells upon HR; G: Protein content of IL-1ra in culture medium upon HR. Indicated P values were calculated using two-tailed unpaired Student’s t-tests. Data are presented as the mean ± SEM. Data are representative of five independent experiments. nsP > 0.05, aP < 0.05, bP < 0.001. HR: Hypoxia-reoxygenation; NPCs: Nonparenchymal cells; IL-1ra: Interleukin-1 receptor antagonist.
- Citation: Wang ZY, Liu Y, Li SP, Li JJ, Zhang Z, Xiao XC, Ou Y, Wang H, Cai JZ, Yang S. Hypoxia inducible factor 1α promotes interleukin-1 receptor antagonist expression during hepatic ischemia-reperfusion injury. World J Gastroenterol 2022; 28(38): 5573-5588
- URL: https://www.wjgnet.com/1007-9327/full/v28/i38/5573.htm
- DOI: https://dx.doi.org/10.3748/wjg.v28.i38.5573


