Copyright
©The Author(s) 2022.
World J Gastroenterol. Oct 14, 2022; 28(38): 5557-5572
Published online Oct 14, 2022. doi: 10.3748/wjg.v28.i38.5557
Published online Oct 14, 2022. doi: 10.3748/wjg.v28.i38.5557
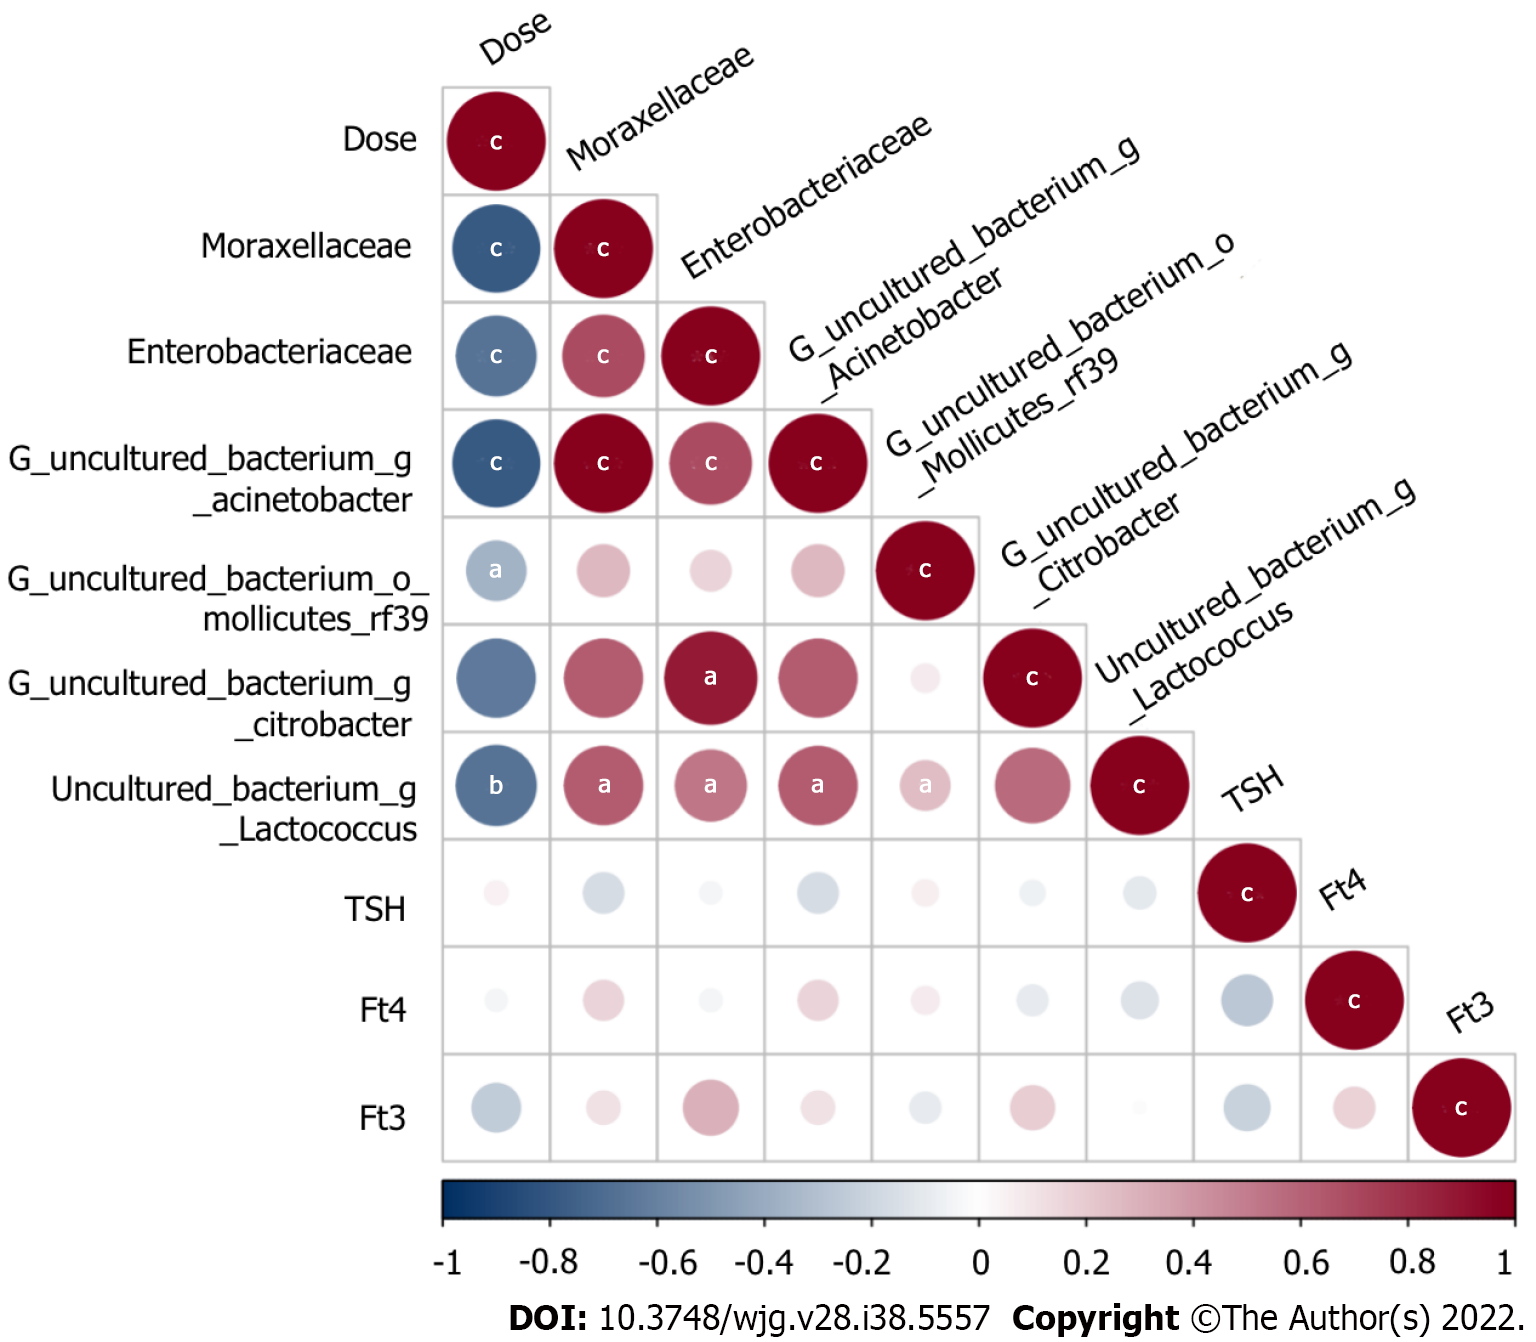
Figure 9 The relationship between the dose and predictive bacteria as well as thyroid function tests.
Positive correlations are represented in red, negative correlations are colored in blue. aP < 0.05; bP < 0.01; cP < 0.001.
- Citation: Tong JY, Jiang W, Yu XQ, Wang R, Lu GH, Gao DW, Lv ZW, Li D. Effect of low-dose radiation on thyroid function and the gut microbiota. World J Gastroenterol 2022; 28(38): 5557-5572
- URL: https://www.wjgnet.com/1007-9327/full/v28/i38/5557.htm
- DOI: https://dx.doi.org/10.3748/wjg.v28.i38.5557


