Copyright
©The Author(s) 2022.
World J Gastroenterol. Oct 14, 2022; 28(38): 5557-5572
Published online Oct 14, 2022. doi: 10.3748/wjg.v28.i38.5557
Published online Oct 14, 2022. doi: 10.3748/wjg.v28.i38.5557
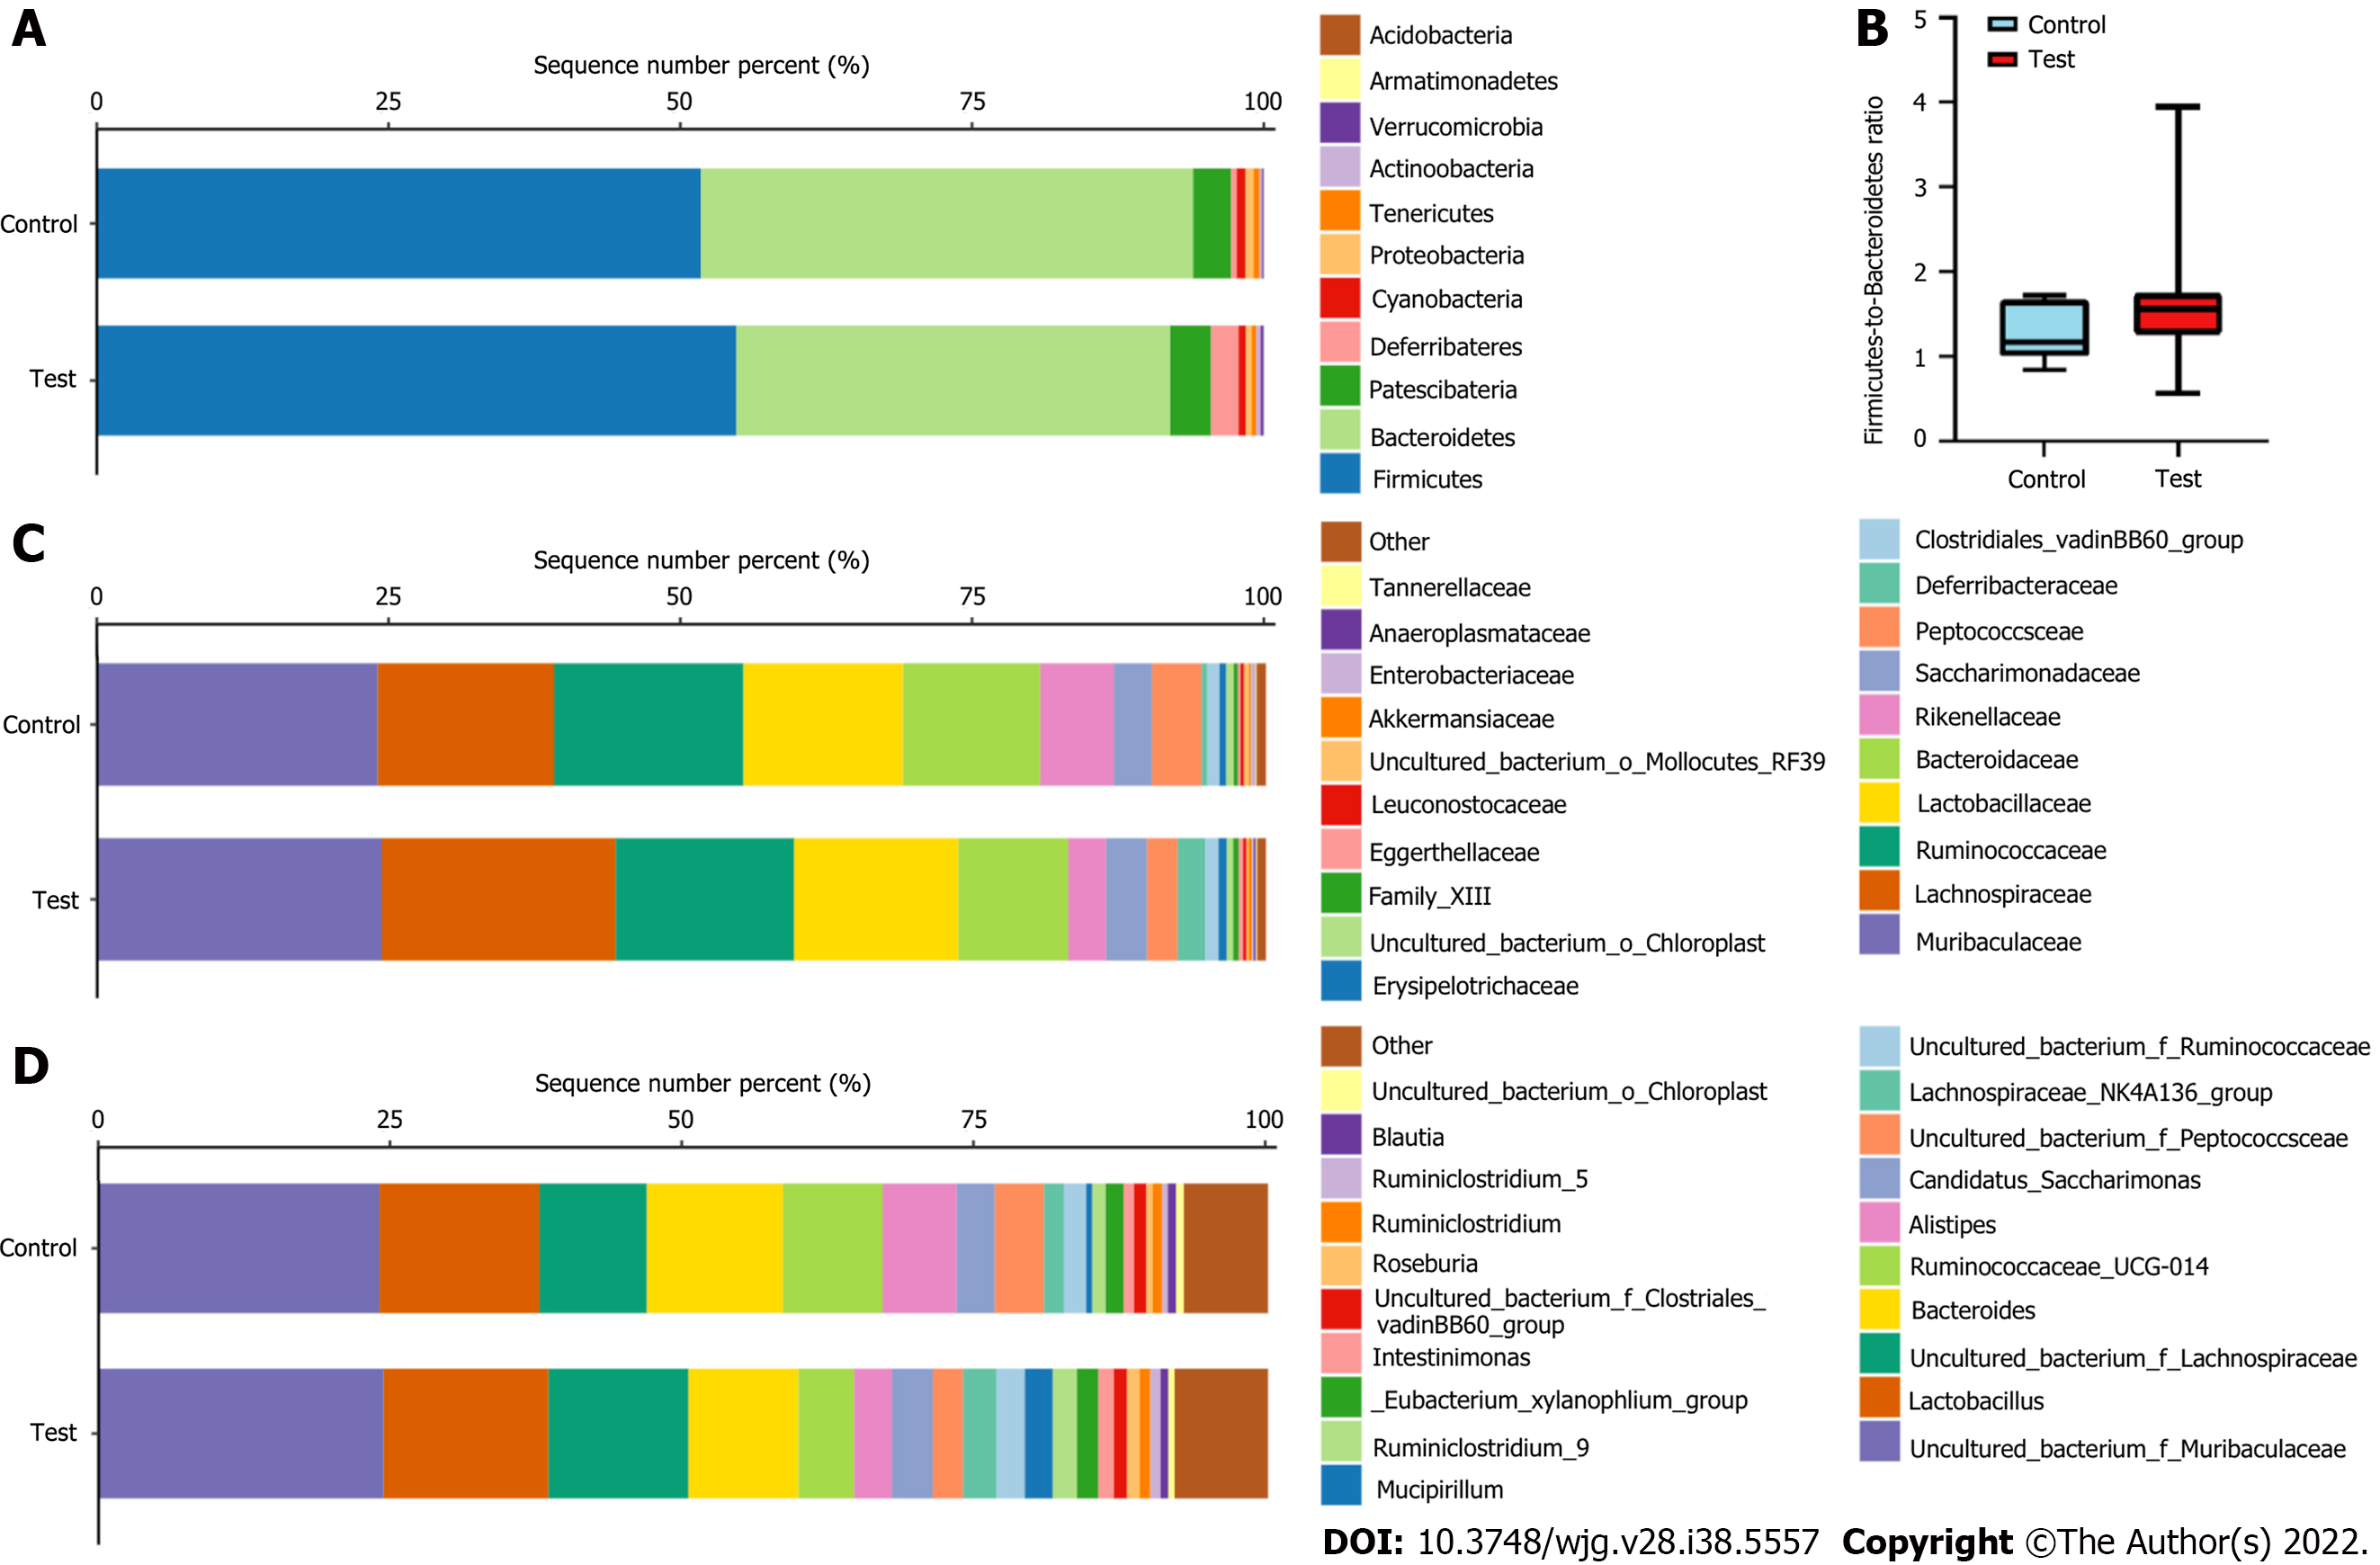
Figure 6 The gut microbiota composition in the control and test groups.
A: Bar plots show the gut microbiota composition at the phylum level; B: Box and whisker plots of the Firmicutes/Bacteroidetes ratio in the control (n = 6) and test groups (n = 24), and there was no difference between the groups; C: Bar plots show the gut microbiota composition at the family level; D: Bar plots show the gut microbiota composition at the genus level.
- Citation: Tong JY, Jiang W, Yu XQ, Wang R, Lu GH, Gao DW, Lv ZW, Li D. Effect of low-dose radiation on thyroid function and the gut microbiota. World J Gastroenterol 2022; 28(38): 5557-5572
- URL: https://www.wjgnet.com/1007-9327/full/v28/i38/5557.htm
- DOI: https://dx.doi.org/10.3748/wjg.v28.i38.5557


