Copyright
©The Author(s) 2022.
World J Gastroenterol. Oct 14, 2022; 28(38): 5557-5572
Published online Oct 14, 2022. doi: 10.3748/wjg.v28.i38.5557
Published online Oct 14, 2022. doi: 10.3748/wjg.v28.i38.5557
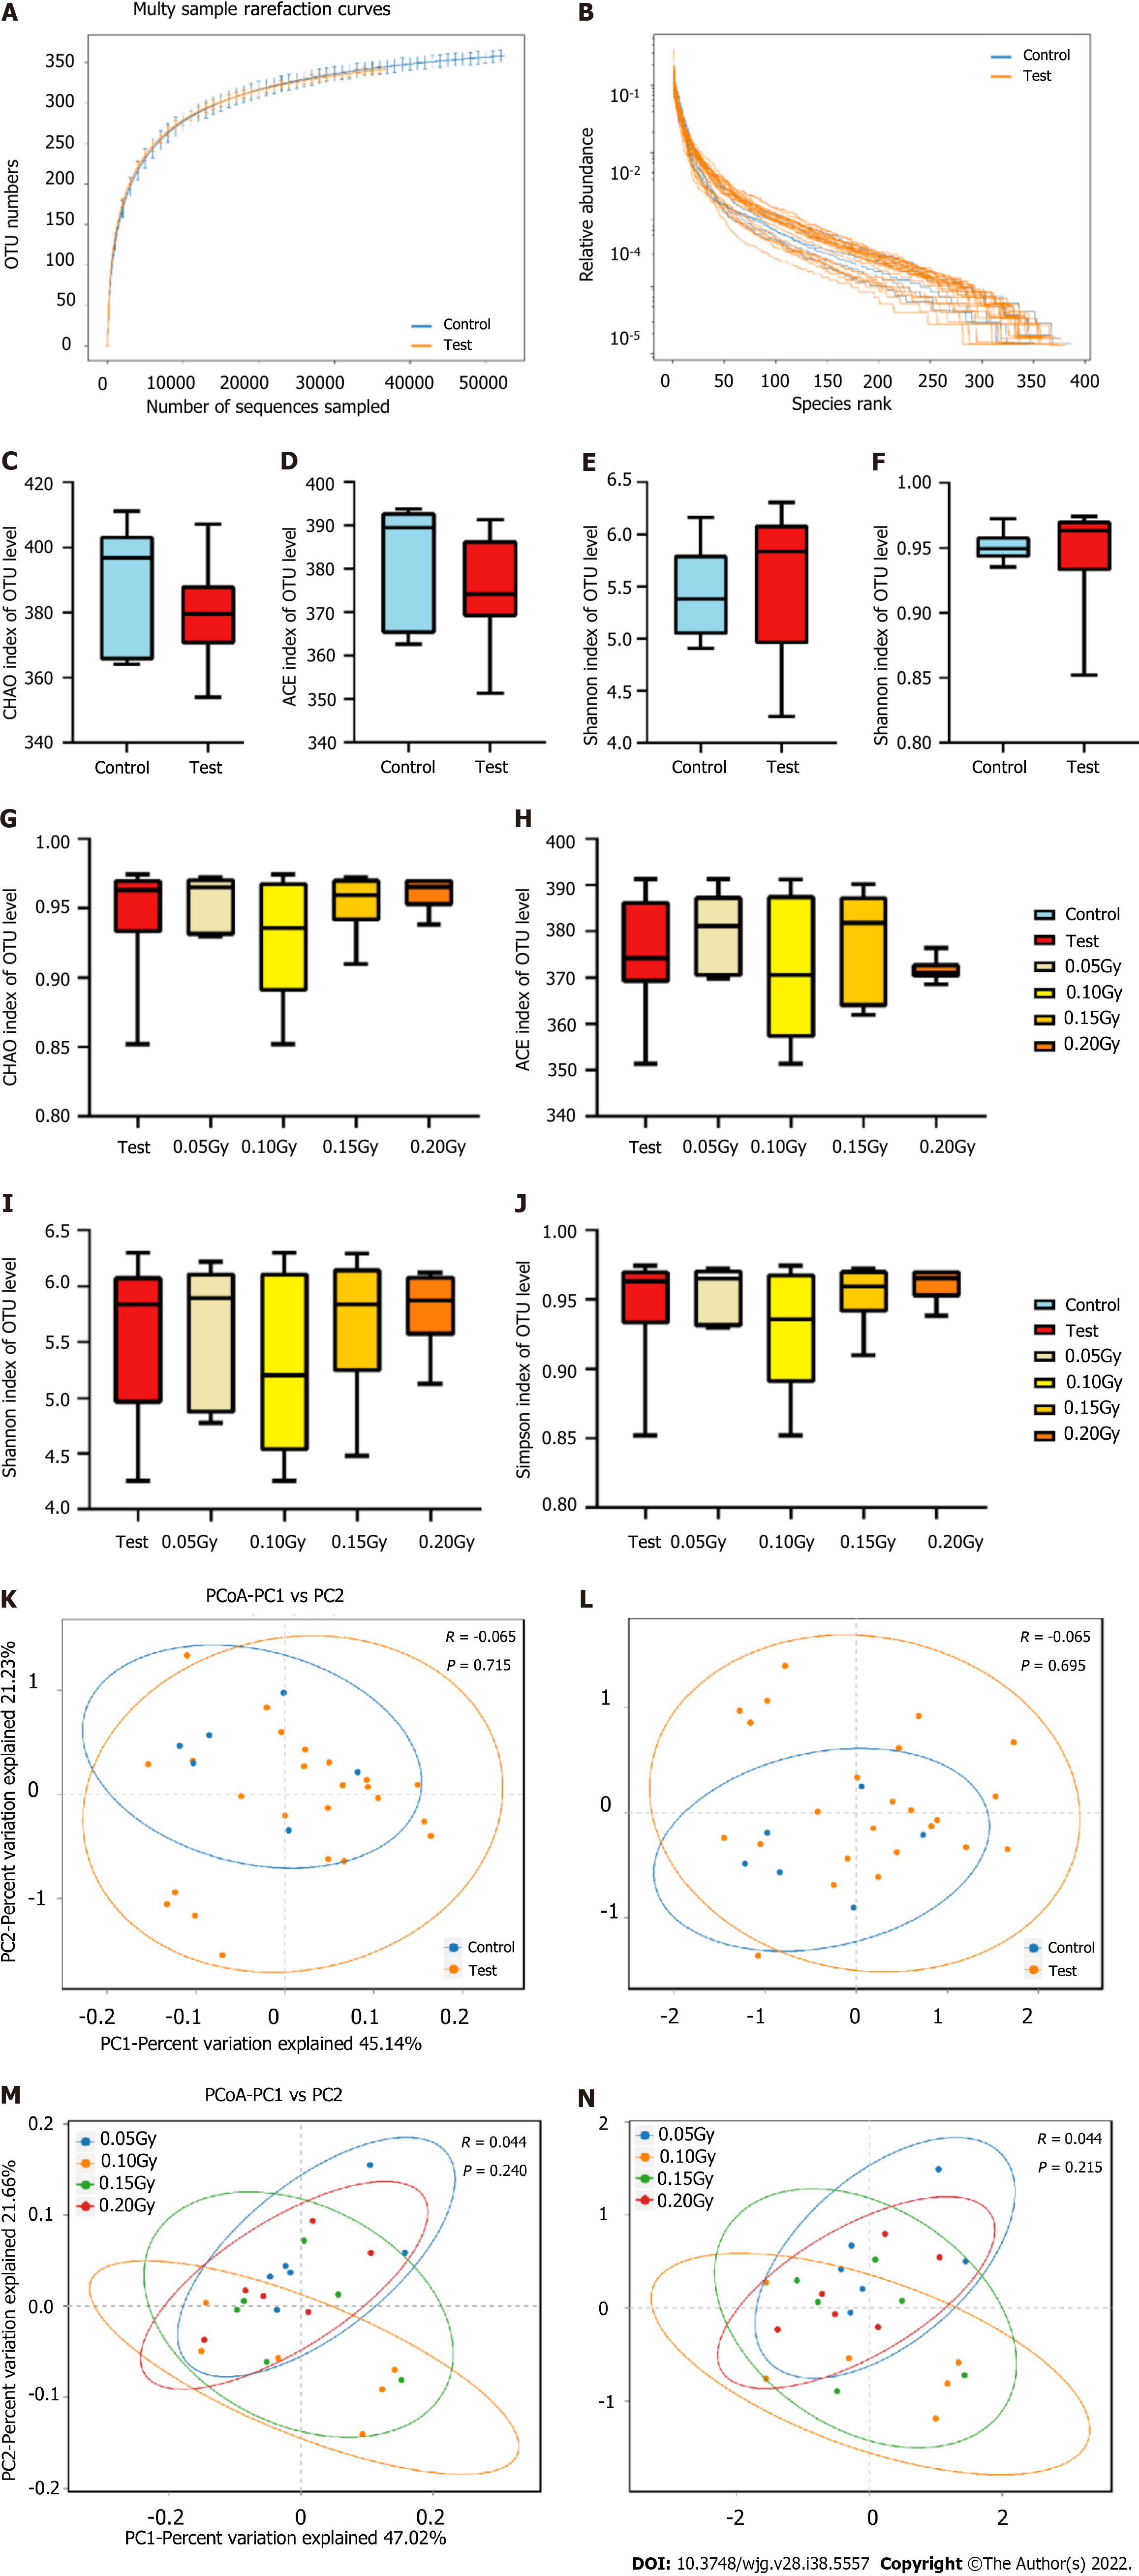
Figure 5 Bioinformatic analysis of 16S rRNA gene sequencing data in the exploratory cohort at the operational taxonomic units level.
A and B: Rank-abundance curves and rarefaction curves (SOB index) of the gut microbiota; C-F: Box and whisker plots of the alpha diversity indices for richness (Chao index and Ace index) and diversity (Shannon index and Simpson index) of the bacterial communities in control mice (n = 6) and the test mice (n = 24); G-J: Box and whisker plots of the alpha diversity indices for richness (Chao index and Ace index) and diversity (Shannon index and Simpson index) of the bacterial communities among the test subgroups (0.05 Gy, 0.10 Gy, 0.15 Gy, and 0.20 Gy; n = 6 in each group); K and L: Principal coordinates analysis (PCoA) and nonmetric multidimensional scaling (NMDS) analyses indicated that the microbial diversity differed nonsignificantly between the control and test groups based on the unweighted UniFrac distance (PCoA, R = -0.065, P = -0.715; NMDS, R = -0.065, P = 0.695); M and N: PCoA and NMDS analyses indicated that the microbial diversity differed nonsignificantly among the test subgroups based on the unweighted UniFrac distance (PCoA, R = 0.004, P = 0.24; NMDS, R = 0.215, P = 0.695).
- Citation: Tong JY, Jiang W, Yu XQ, Wang R, Lu GH, Gao DW, Lv ZW, Li D. Effect of low-dose radiation on thyroid function and the gut microbiota. World J Gastroenterol 2022; 28(38): 5557-5572
- URL: https://www.wjgnet.com/1007-9327/full/v28/i38/5557.htm
- DOI: https://dx.doi.org/10.3748/wjg.v28.i38.5557


