Copyright
©The Author(s) 2022.
World J Gastroenterol. Oct 14, 2022; 28(38): 5557-5572
Published online Oct 14, 2022. doi: 10.3748/wjg.v28.i38.5557
Published online Oct 14, 2022. doi: 10.3748/wjg.v28.i38.5557
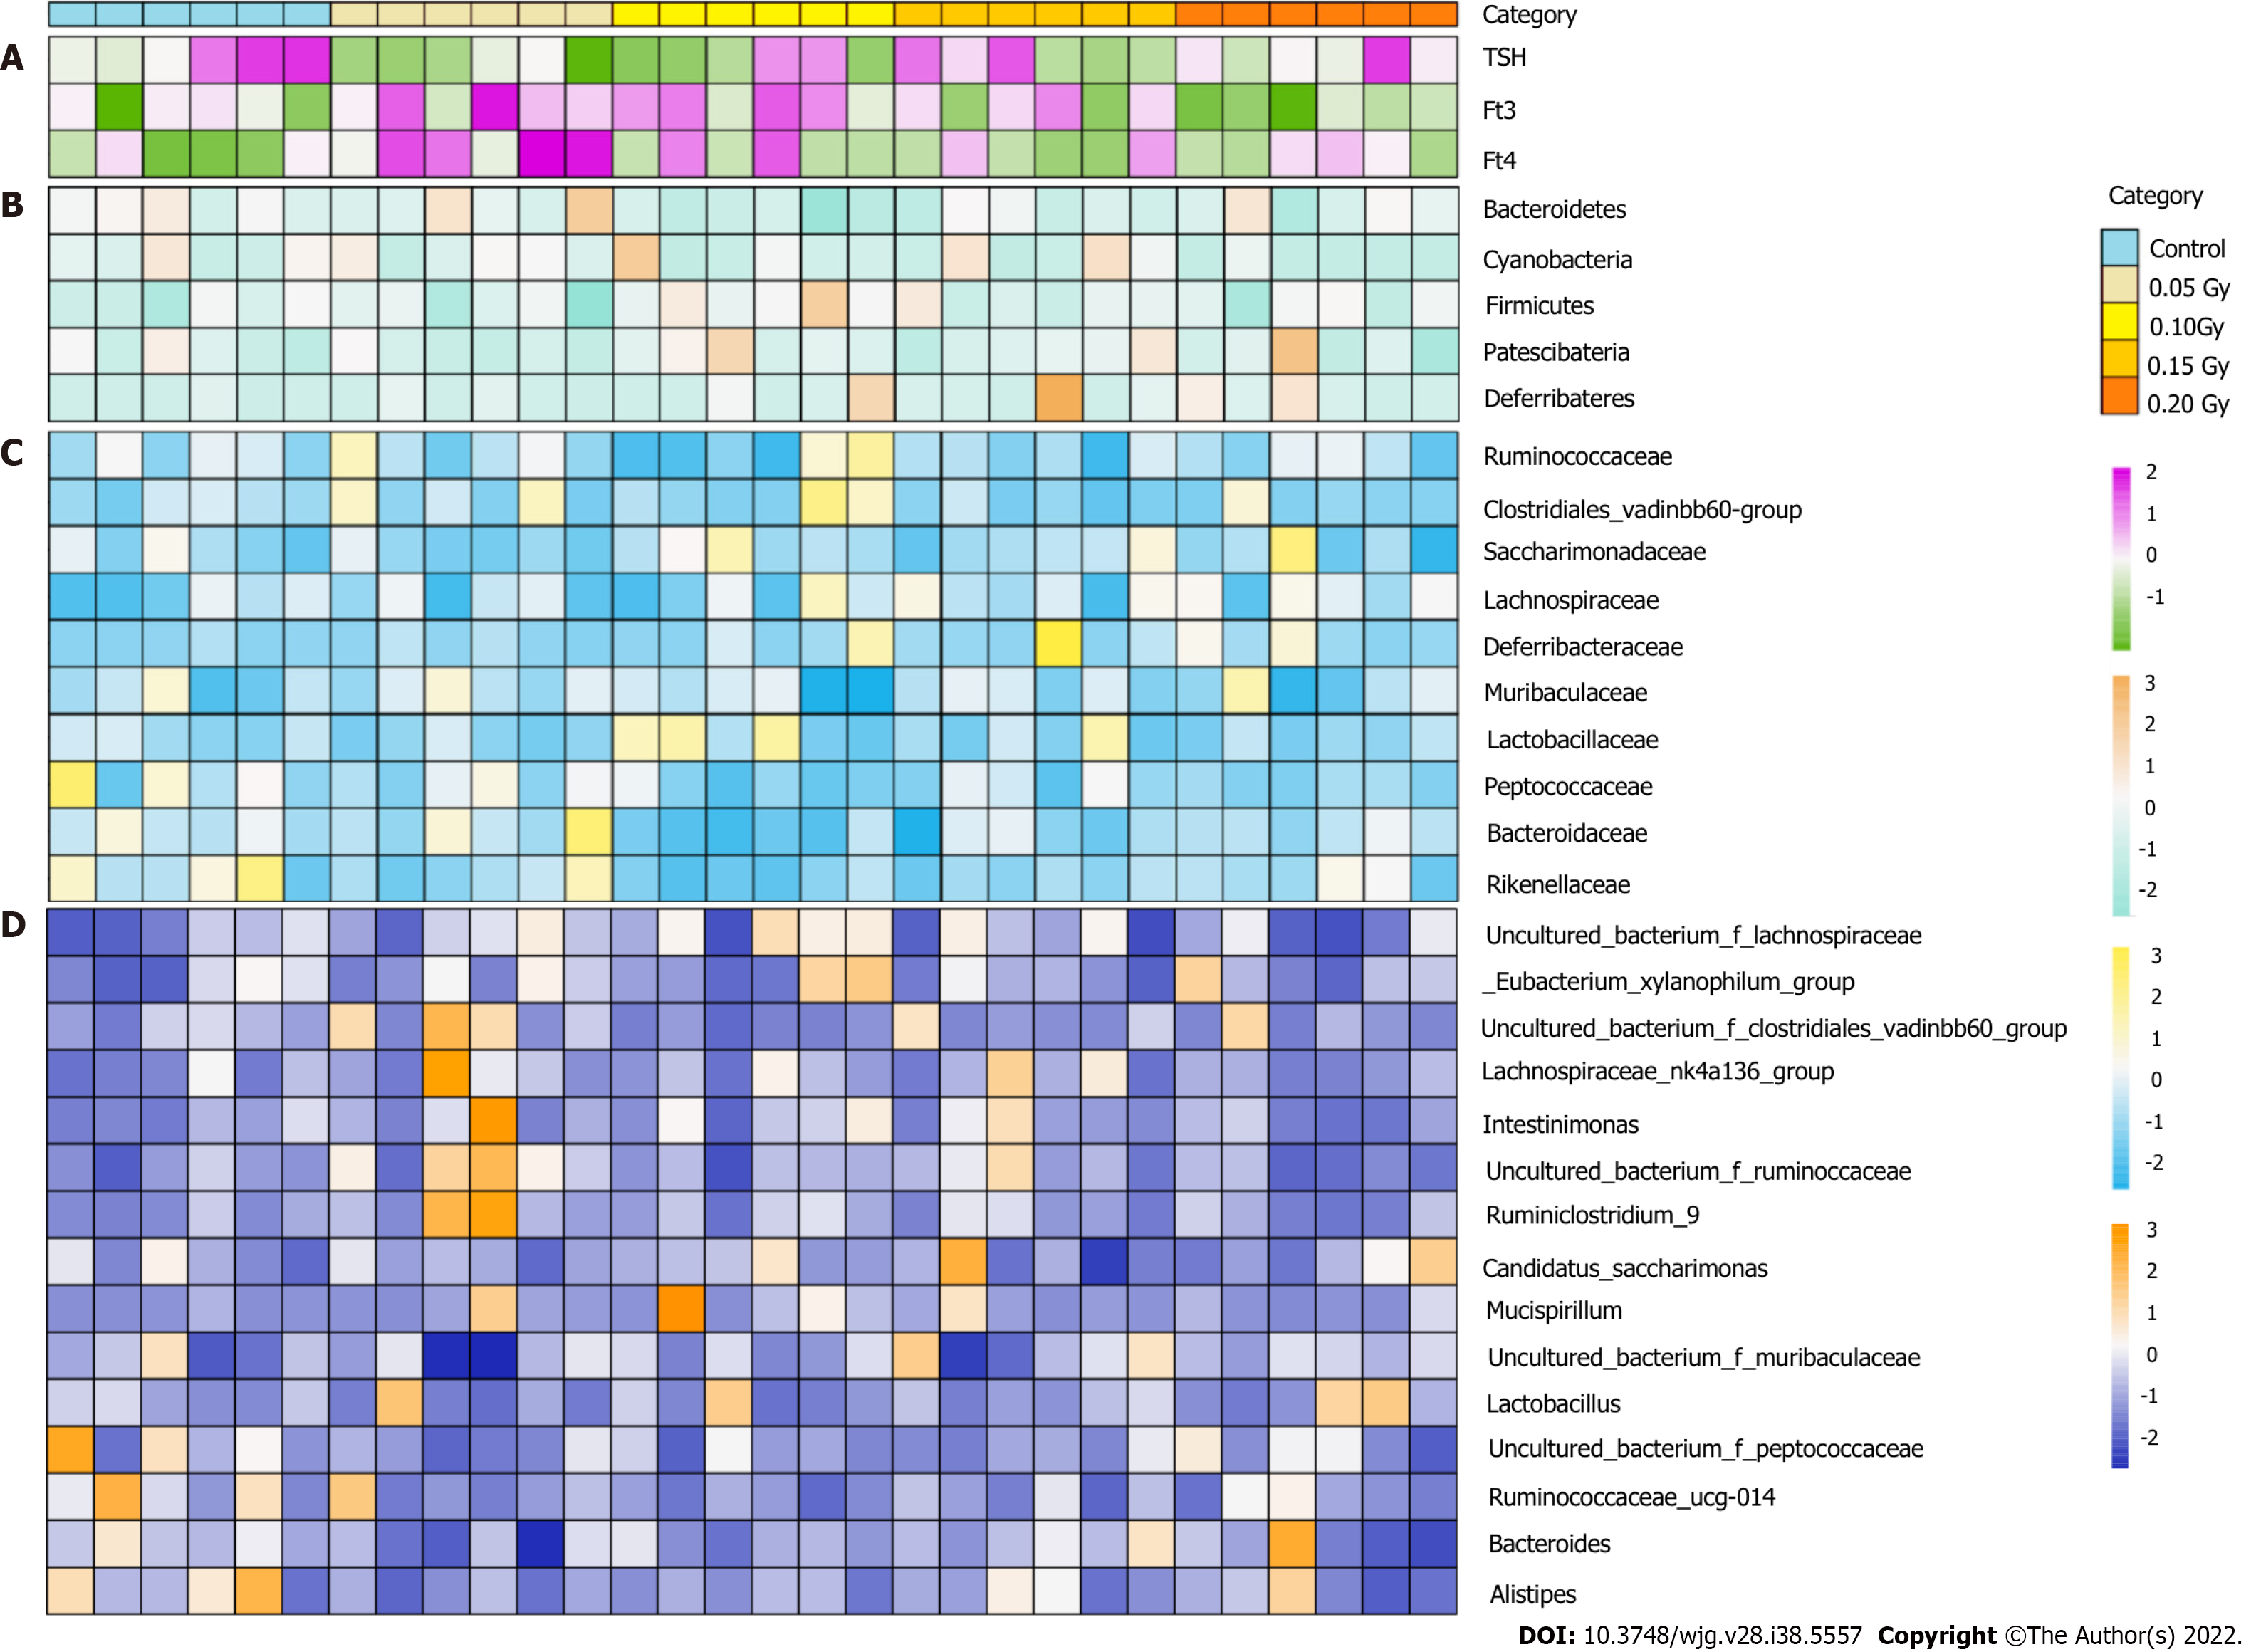
Figure 4 Taxonomic features of the thyroid hormone level and gut microbiota in the control mice (n = 6) and radiation-exposed group (n = 24).
A-D: The thyroid hormone level for all subjects (A), with an overview of the 5 most abundant phyla (B), 10 most abundant families (C) and 15 most abundant genera (D) in fecal samples identified by 16S rRNA gene sequencing. The taxa levels were determined by summing the operational taxonomic units and are presented by relative abundance.
- Citation: Tong JY, Jiang W, Yu XQ, Wang R, Lu GH, Gao DW, Lv ZW, Li D. Effect of low-dose radiation on thyroid function and the gut microbiota. World J Gastroenterol 2022; 28(38): 5557-5572
- URL: https://www.wjgnet.com/1007-9327/full/v28/i38/5557.htm
- DOI: https://dx.doi.org/10.3748/wjg.v28.i38.5557


