Copyright
©The Author(s) 2022.
World J Gastroenterol. Oct 14, 2022; 28(38): 5557-5572
Published online Oct 14, 2022. doi: 10.3748/wjg.v28.i38.5557
Published online Oct 14, 2022. doi: 10.3748/wjg.v28.i38.5557
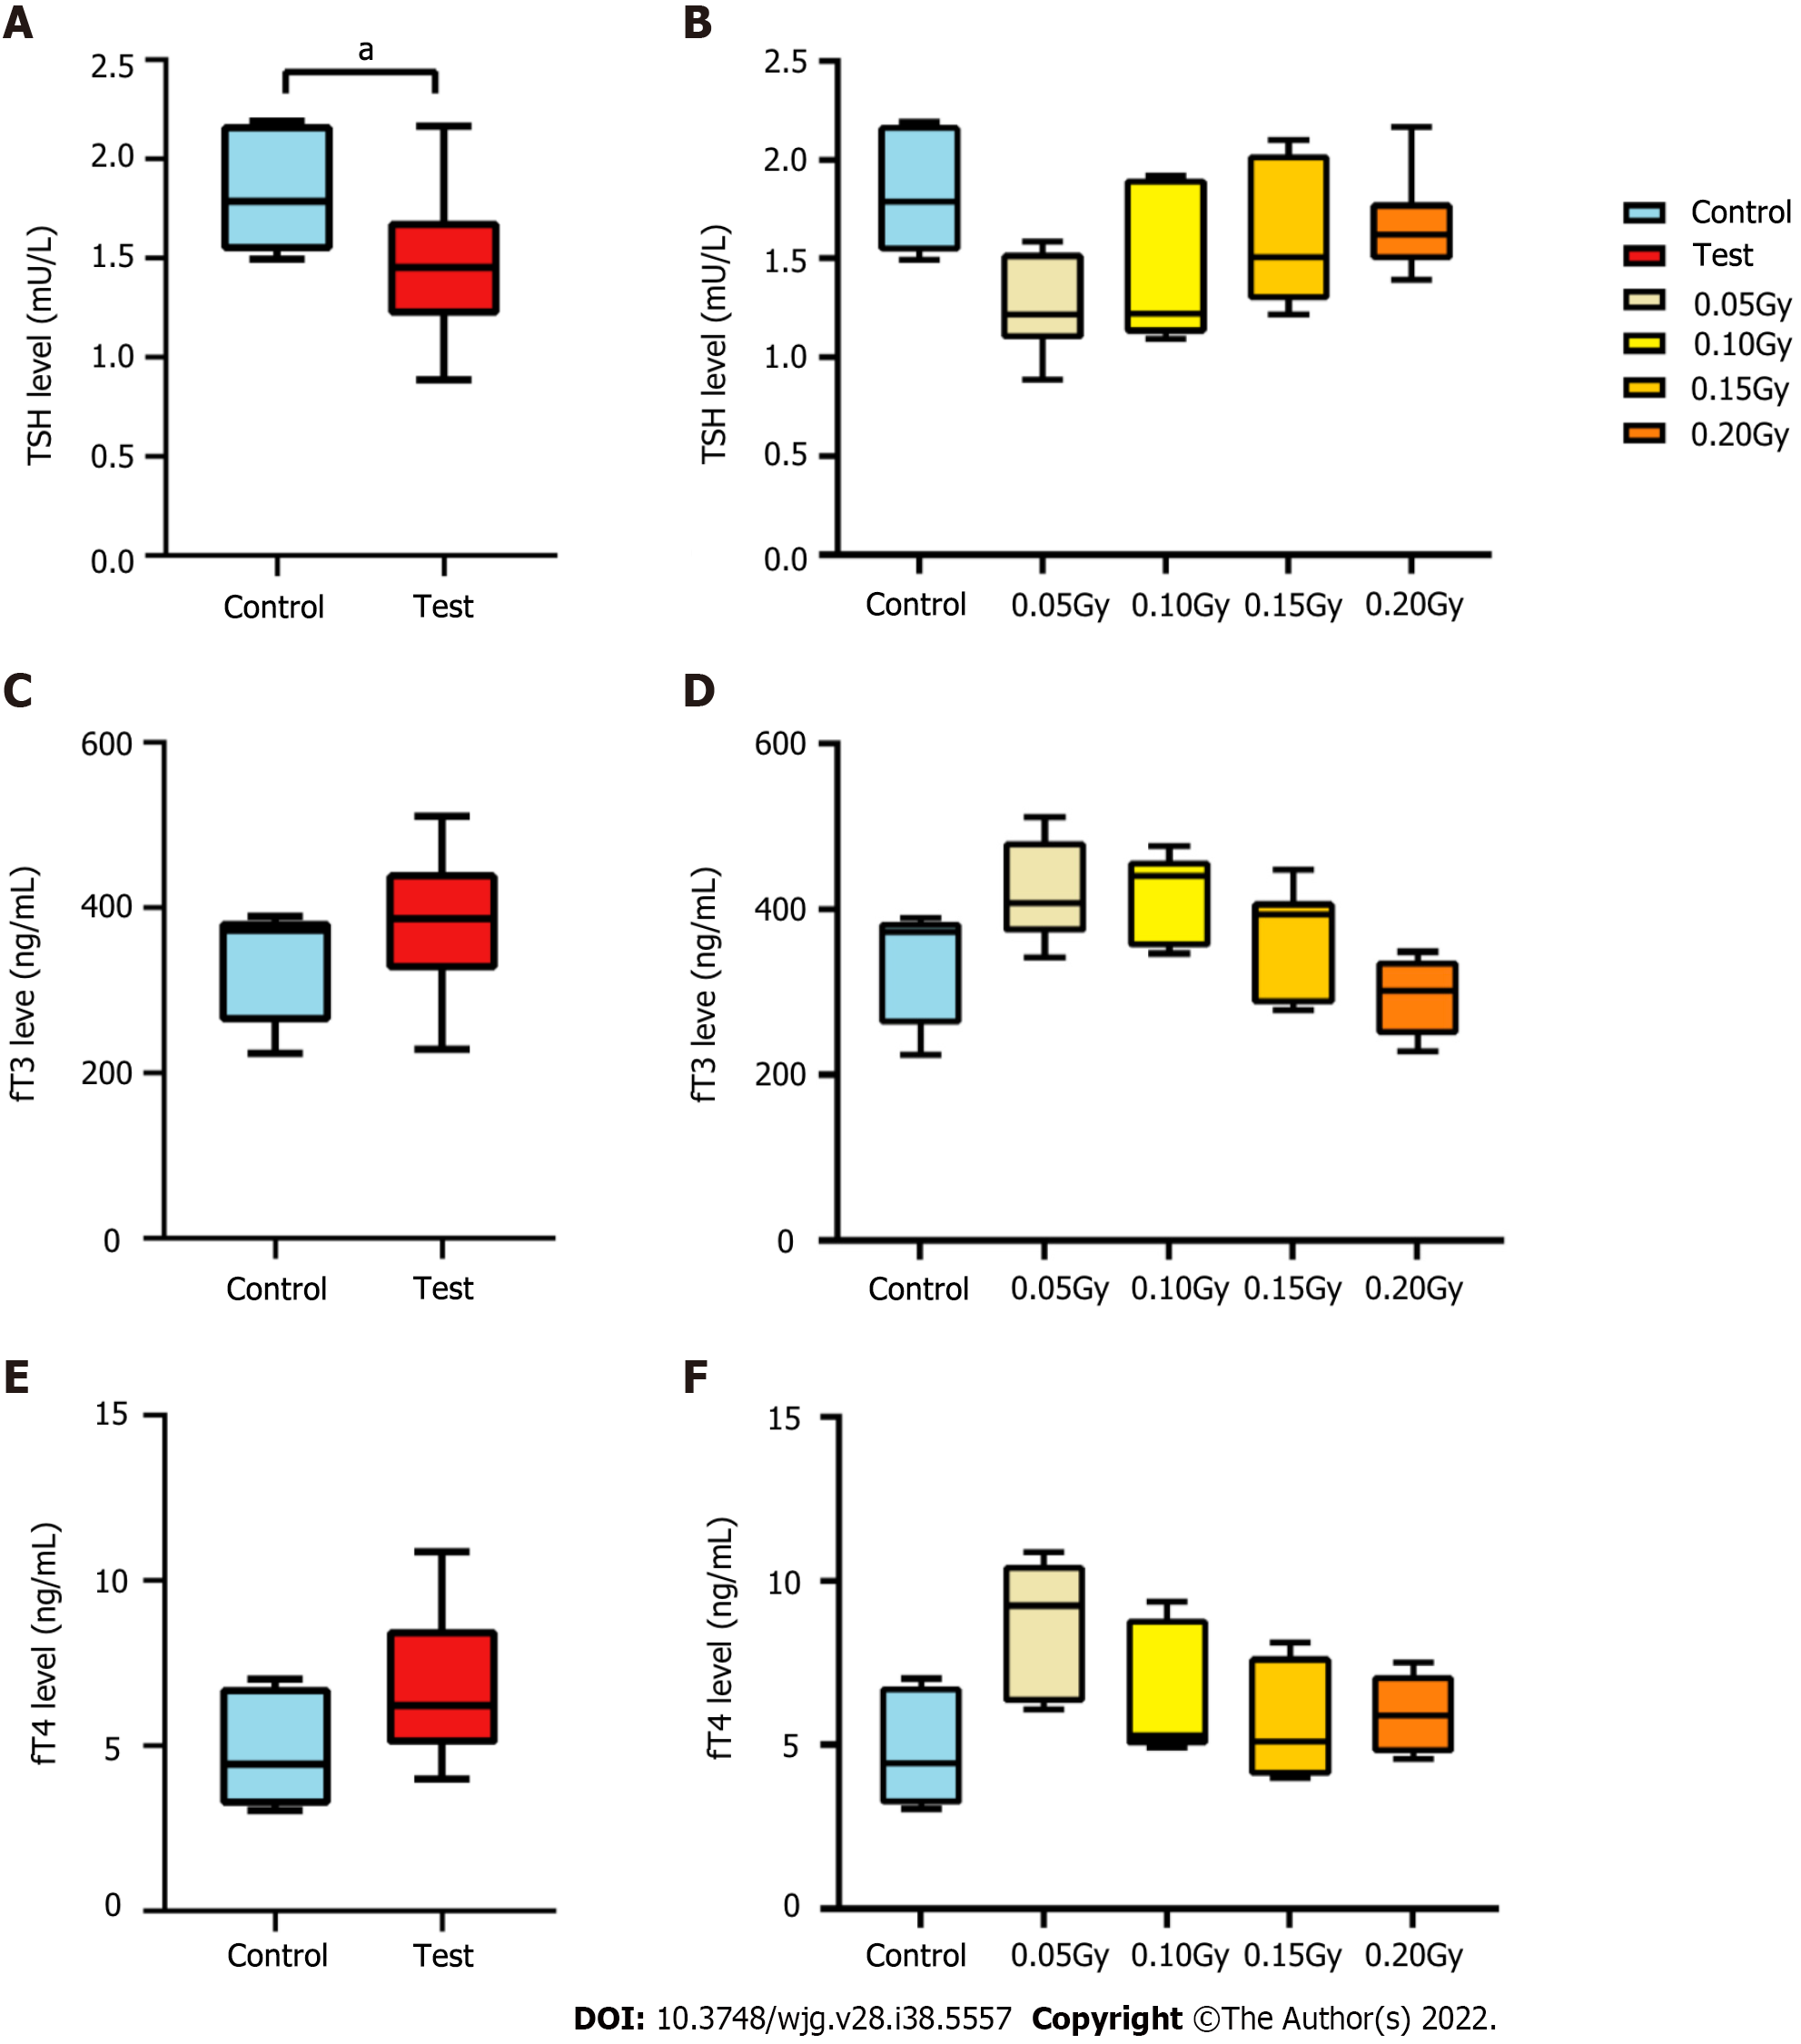
Figure 2 The level of thyroid hormone in mice exposed to radiation.
A: Box and whisker plots of the levels of thyroid stimulating hormone (TSH) in the control (n = 6) and test (n = 24) groups. The TSH level of the mice in the test group was lower than that in the control mice (t = 2.188, P = 0.037); B: Histogram of the levels of TSH from the control and test groups. Statistically significant differences were not confirmed between the two groups; C: Box and whisker plots of the level of fT3 in the control (n = 6) and test groups (n = 24); D: Histogram of the level of fT3 in the control and test subgroups; E: Box and whisker plots of the level of fT4 in the control (n = 6) and test groups (n = 24); F: Histogram of the level of fT4 in the control and test subgroups. TSH: Thyroid stimulating hormone. aP < 0.05.
- Citation: Tong JY, Jiang W, Yu XQ, Wang R, Lu GH, Gao DW, Lv ZW, Li D. Effect of low-dose radiation on thyroid function and the gut microbiota. World J Gastroenterol 2022; 28(38): 5557-5572
- URL: https://www.wjgnet.com/1007-9327/full/v28/i38/5557.htm
- DOI: https://dx.doi.org/10.3748/wjg.v28.i38.5557


