Copyright
©The Author(s) 2022.
World J Gastroenterol. Sep 21, 2022; 28(35): 5188-5202
Published online Sep 21, 2022. doi: 10.3748/wjg.v28.i35.5188
Published online Sep 21, 2022. doi: 10.3748/wjg.v28.i35.5188
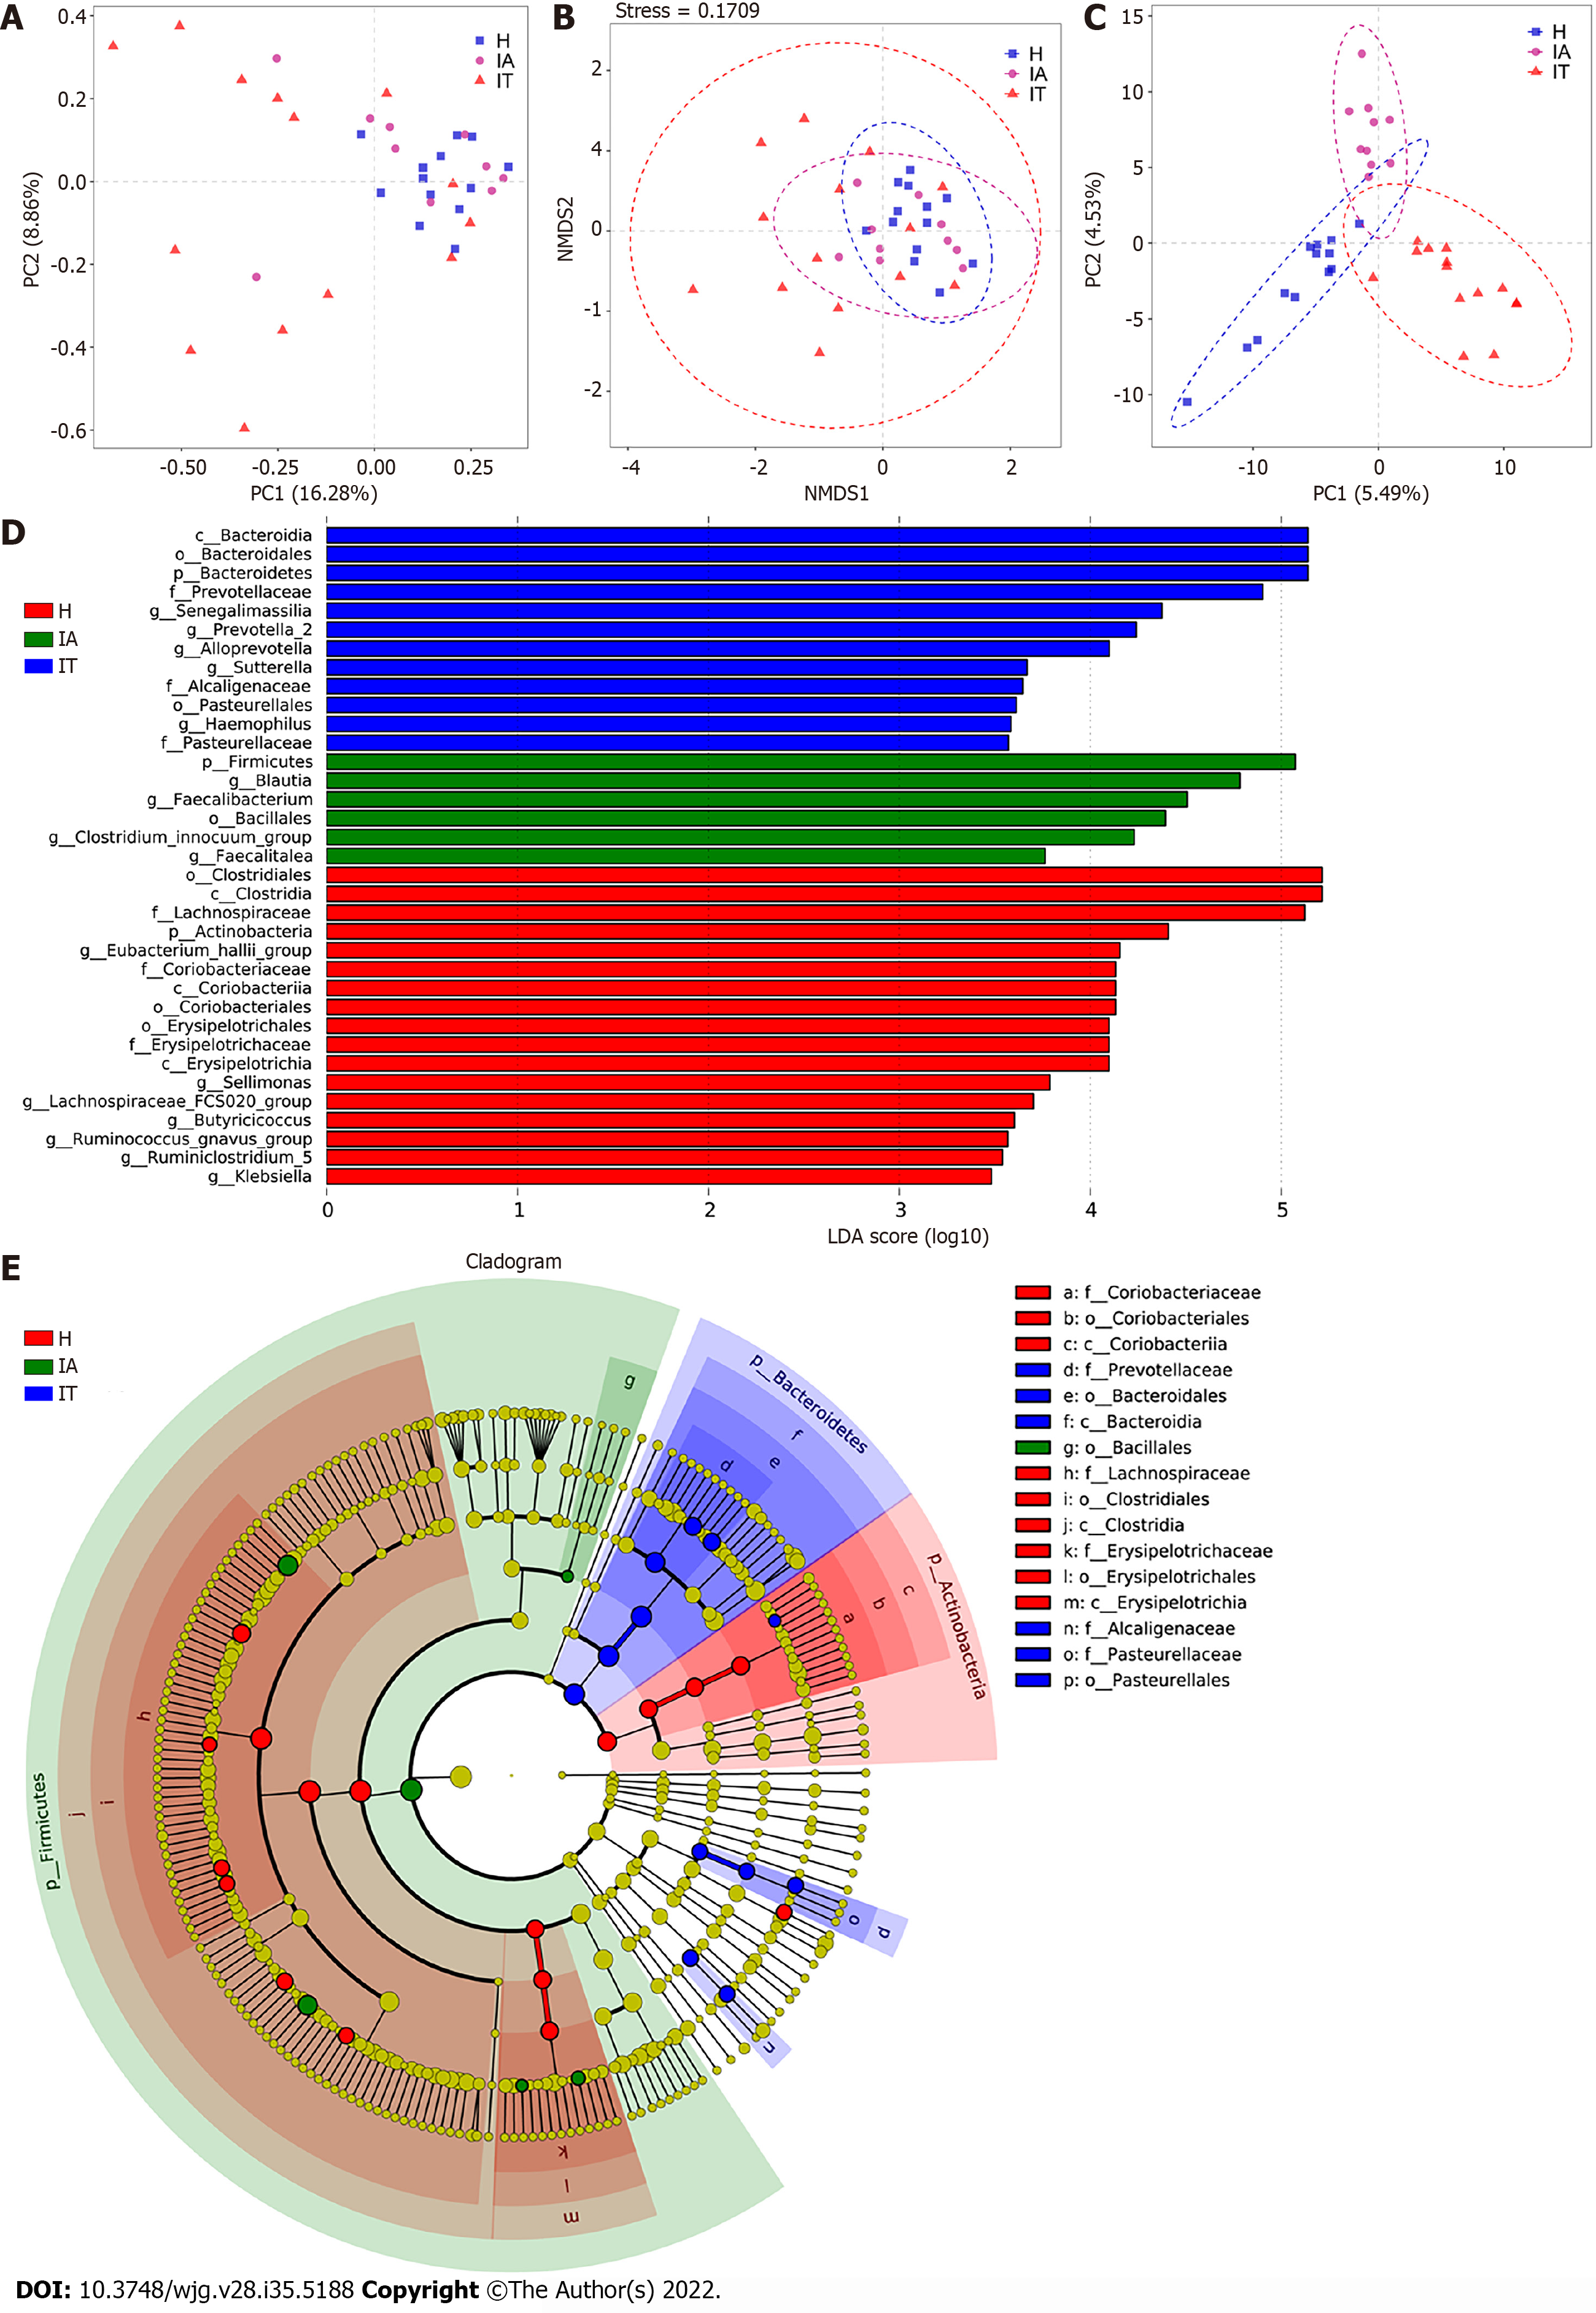
Figure 2 Beta-diversity analysis and comparison of variation in microbiota in the three groups using the linear discriminant analysis effect size online tool.
A: Principal component analysis on the relative abundance. Each point represents a sample, plotted by the second principal component on the Y-axis and the first principal component on the X-axis and colored by group; B: Comparison of the sample distribution of different subgroups using weighted non-metric multidimensional scaling analysis. Each sample is represented by a dot; C: Partial least squares discrimination analysis. Each point represents a sample; D: Histogram of the linear discriminant analysis (LDA) scores for differentially abundant genera between groups (a logarithmic LDA score > 3 indicated a higher relative abundance in the corresponding group compared to the other group); E: The taxonomic cladogram obtained from the LDA effect size analysis of 16S sequences and taxonomic representation of statistically significant differences between groups. The diameter of each circle is proportional to the taxon abundance. LDA: Linear discriminant analysis; IT: Immune-tolerant; IA: Immune-active; H: Healthy.
- Citation: Li YN, Kang NL, Jiang JJ, Zhu YY, Liu YR, Zeng DW, Wang F. Gut microbiota of hepatitis B virus-infected patients in the immune-tolerant and immune-active phases and their implications in metabolite changes. World J Gastroenterol 2022; 28(35): 5188-5202
- URL: https://www.wjgnet.com/1007-9327/full/v28/i35/5188.htm
- DOI: https://dx.doi.org/10.3748/wjg.v28.i35.5188


