Copyright
©The Author(s) 2022.
World J Gastroenterol. Sep 21, 2022; 28(35): 5154-5174
Published online Sep 21, 2022. doi: 10.3748/wjg.v28.i35.5154
Published online Sep 21, 2022. doi: 10.3748/wjg.v28.i35.5154
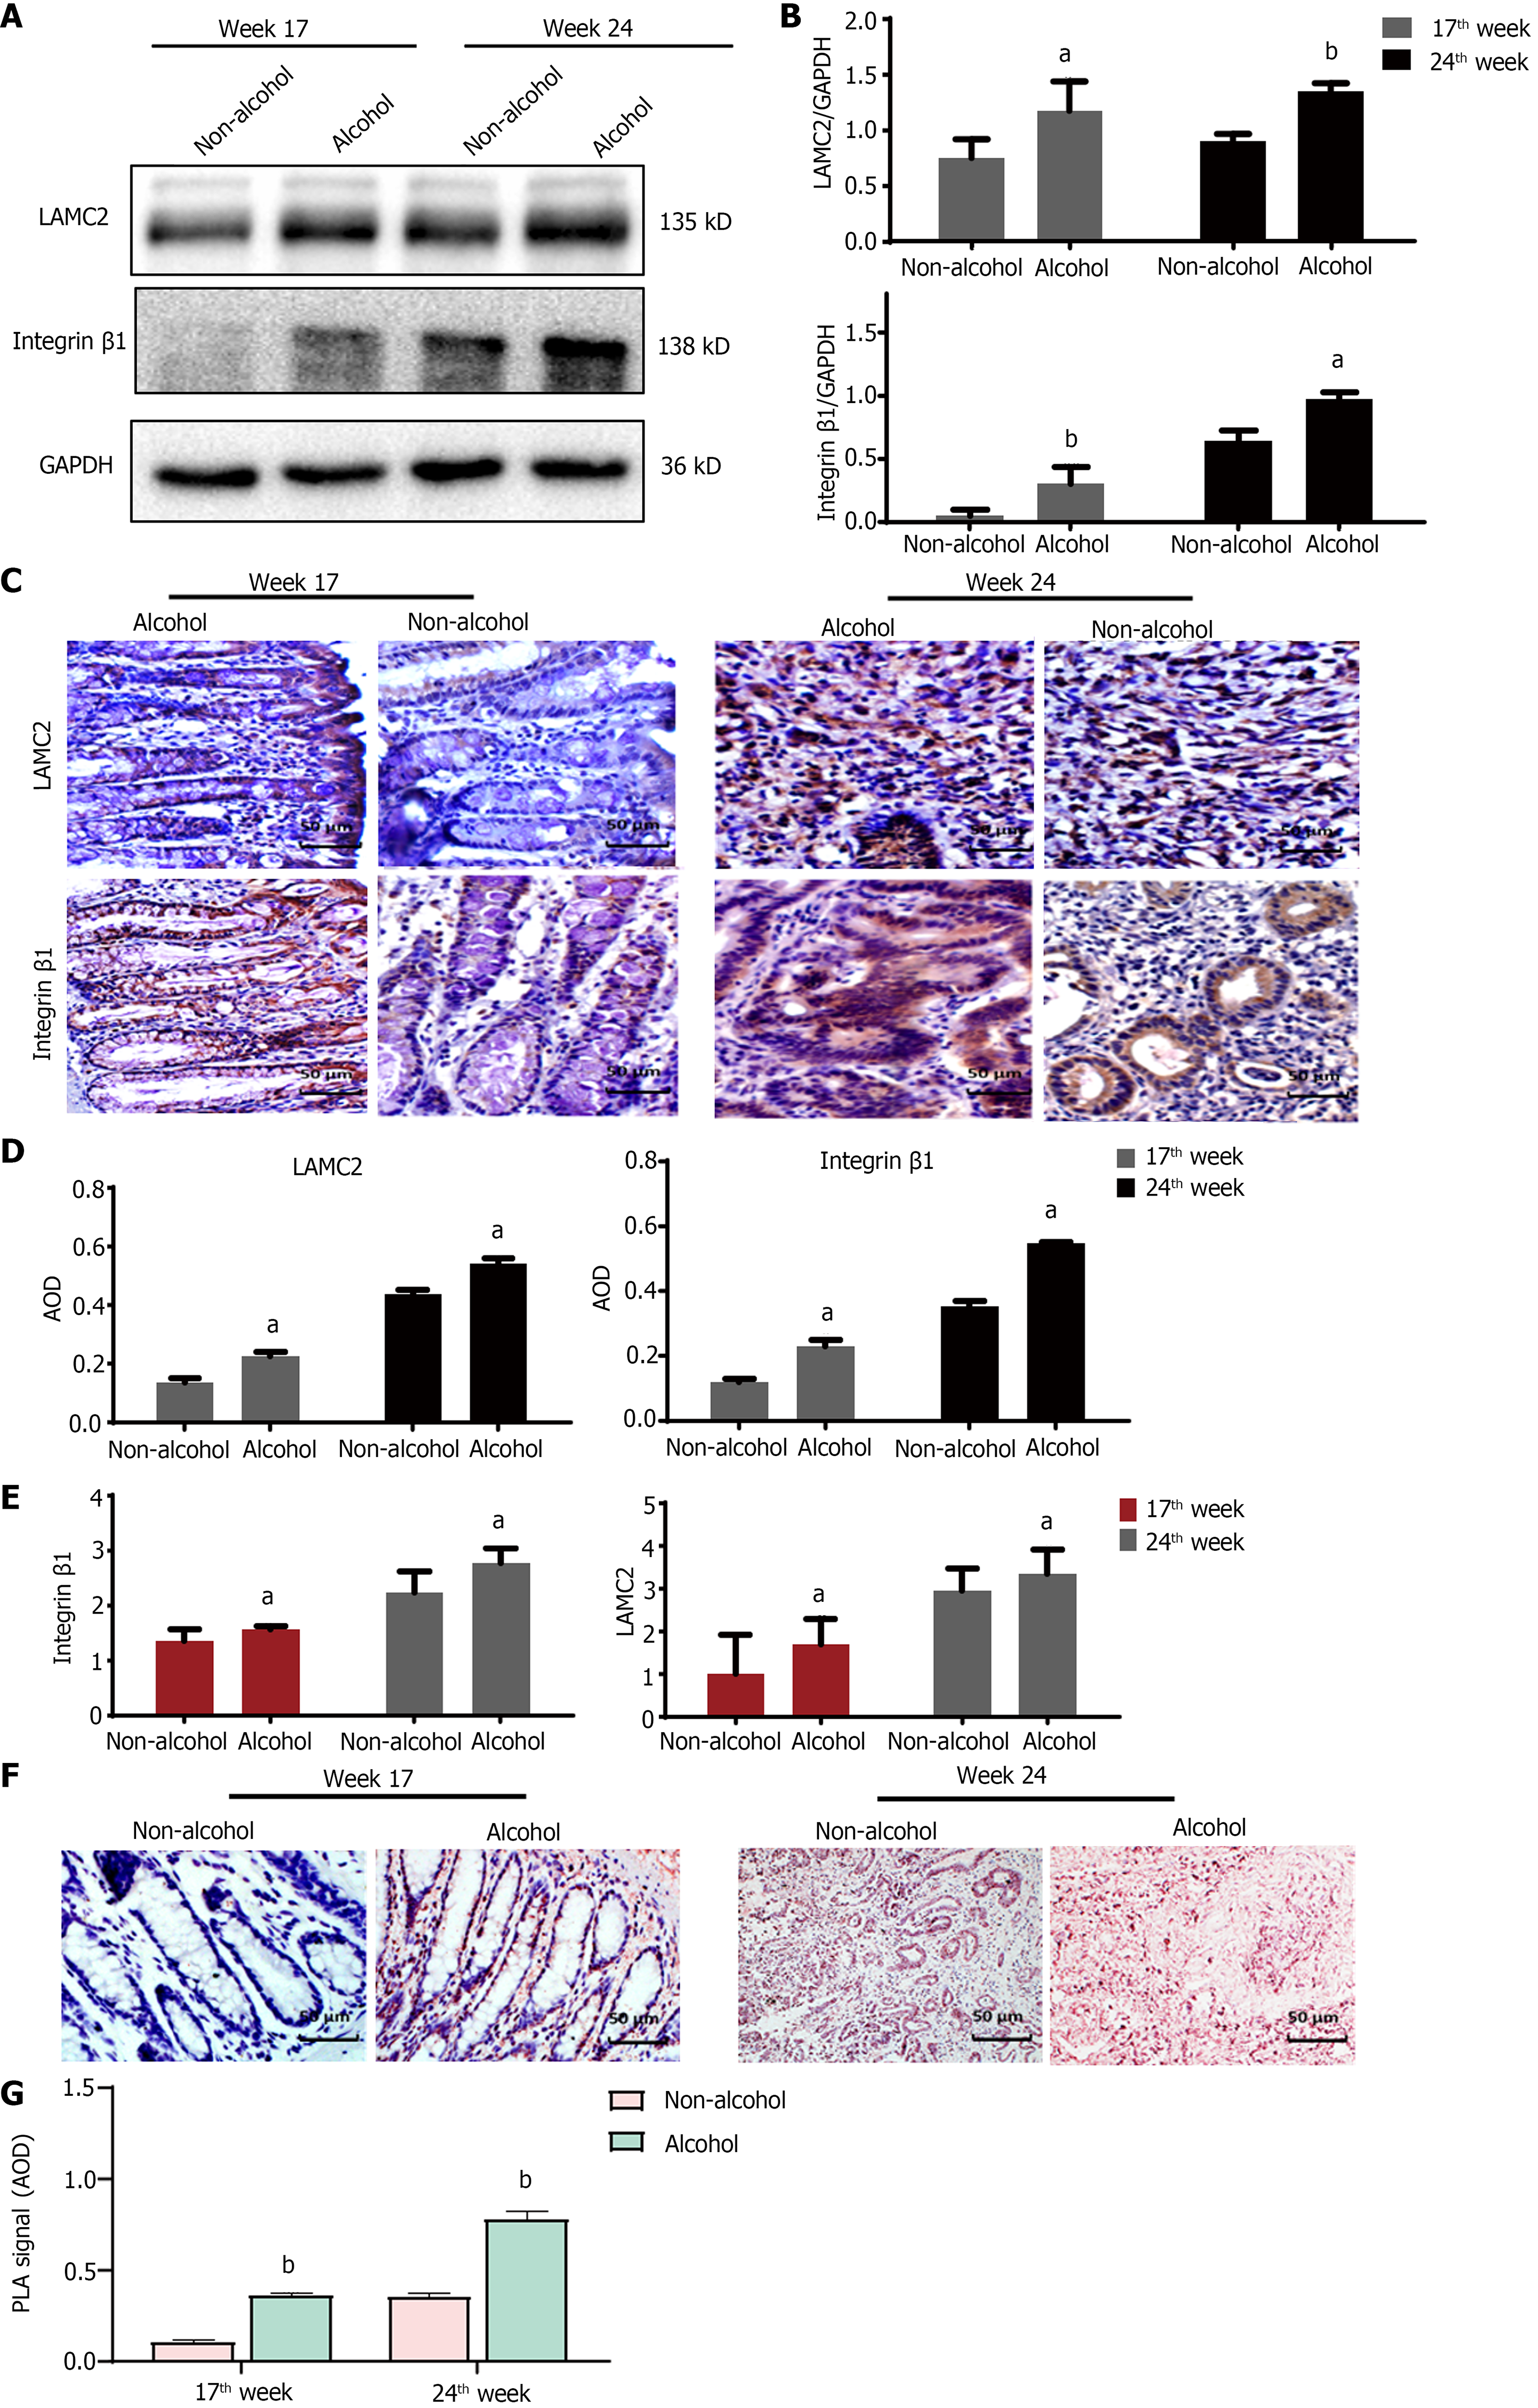
Figure 3 Alcohol consumption regulates the expression and interaction of integrin-β1 and laminin-γ2 in animal samples.
The bars represent the mean ± SD (n = 8). A and B: Quantification of the protein levels of integrin-β1 (ITGB1) and laminin-γ2 (LAMC2) detected by western blotting in animal samples; C and D: Quantification of the protein levels of ITGB1 and LAMC2 by immunohistochemical (IHC) in animal samples; E: Quantification of the mRNA levels of ITGB1 and LAMC2 by quantitative real-time polymerase chain reaction in clinical samples; F: Statistical analysis of IHC was performed by counting the average optical density (AOD). In Duolink proximity ligation assay (PLA), the brown dot particles observed under the microscope represent the interactions between LAMC2 and ITGB1; G: The statistical analysis of PLA positive signals was performed by counting the AOD under a light microscope. Compared with the non-alcohol group: bP < 0.01, aP < 0.05. ITGB1: Integrin-β1; LAMC2: Laminin-γ2; GAPDH: Glyceraldehyde-3-phosphate dehydrogenase; PLA: Proximity ligation assay; IHC: Immunohistochemical staining; AOD: Average optical density.
- Citation: Nong FF, Liang YQ, Xing SP, Xiao YF, Chen HH, Wen B. Alcohol promotes epithelial mesenchymal transformation-mediated premetastatic niche formation of colorectal cancer by activating interaction between laminin-γ2 and integrin-β1. World J Gastroenterol 2022; 28(35): 5154-5174
- URL: https://www.wjgnet.com/1007-9327/full/v28/i35/5154.htm
- DOI: https://dx.doi.org/10.3748/wjg.v28.i35.5154


