Copyright
©The Author(s) 2022.
World J Gastroenterol. Sep 7, 2022; 28(33): 4890-4908
Published online Sep 7, 2022. doi: 10.3748/wjg.v28.i33.4890
Published online Sep 7, 2022. doi: 10.3748/wjg.v28.i33.4890
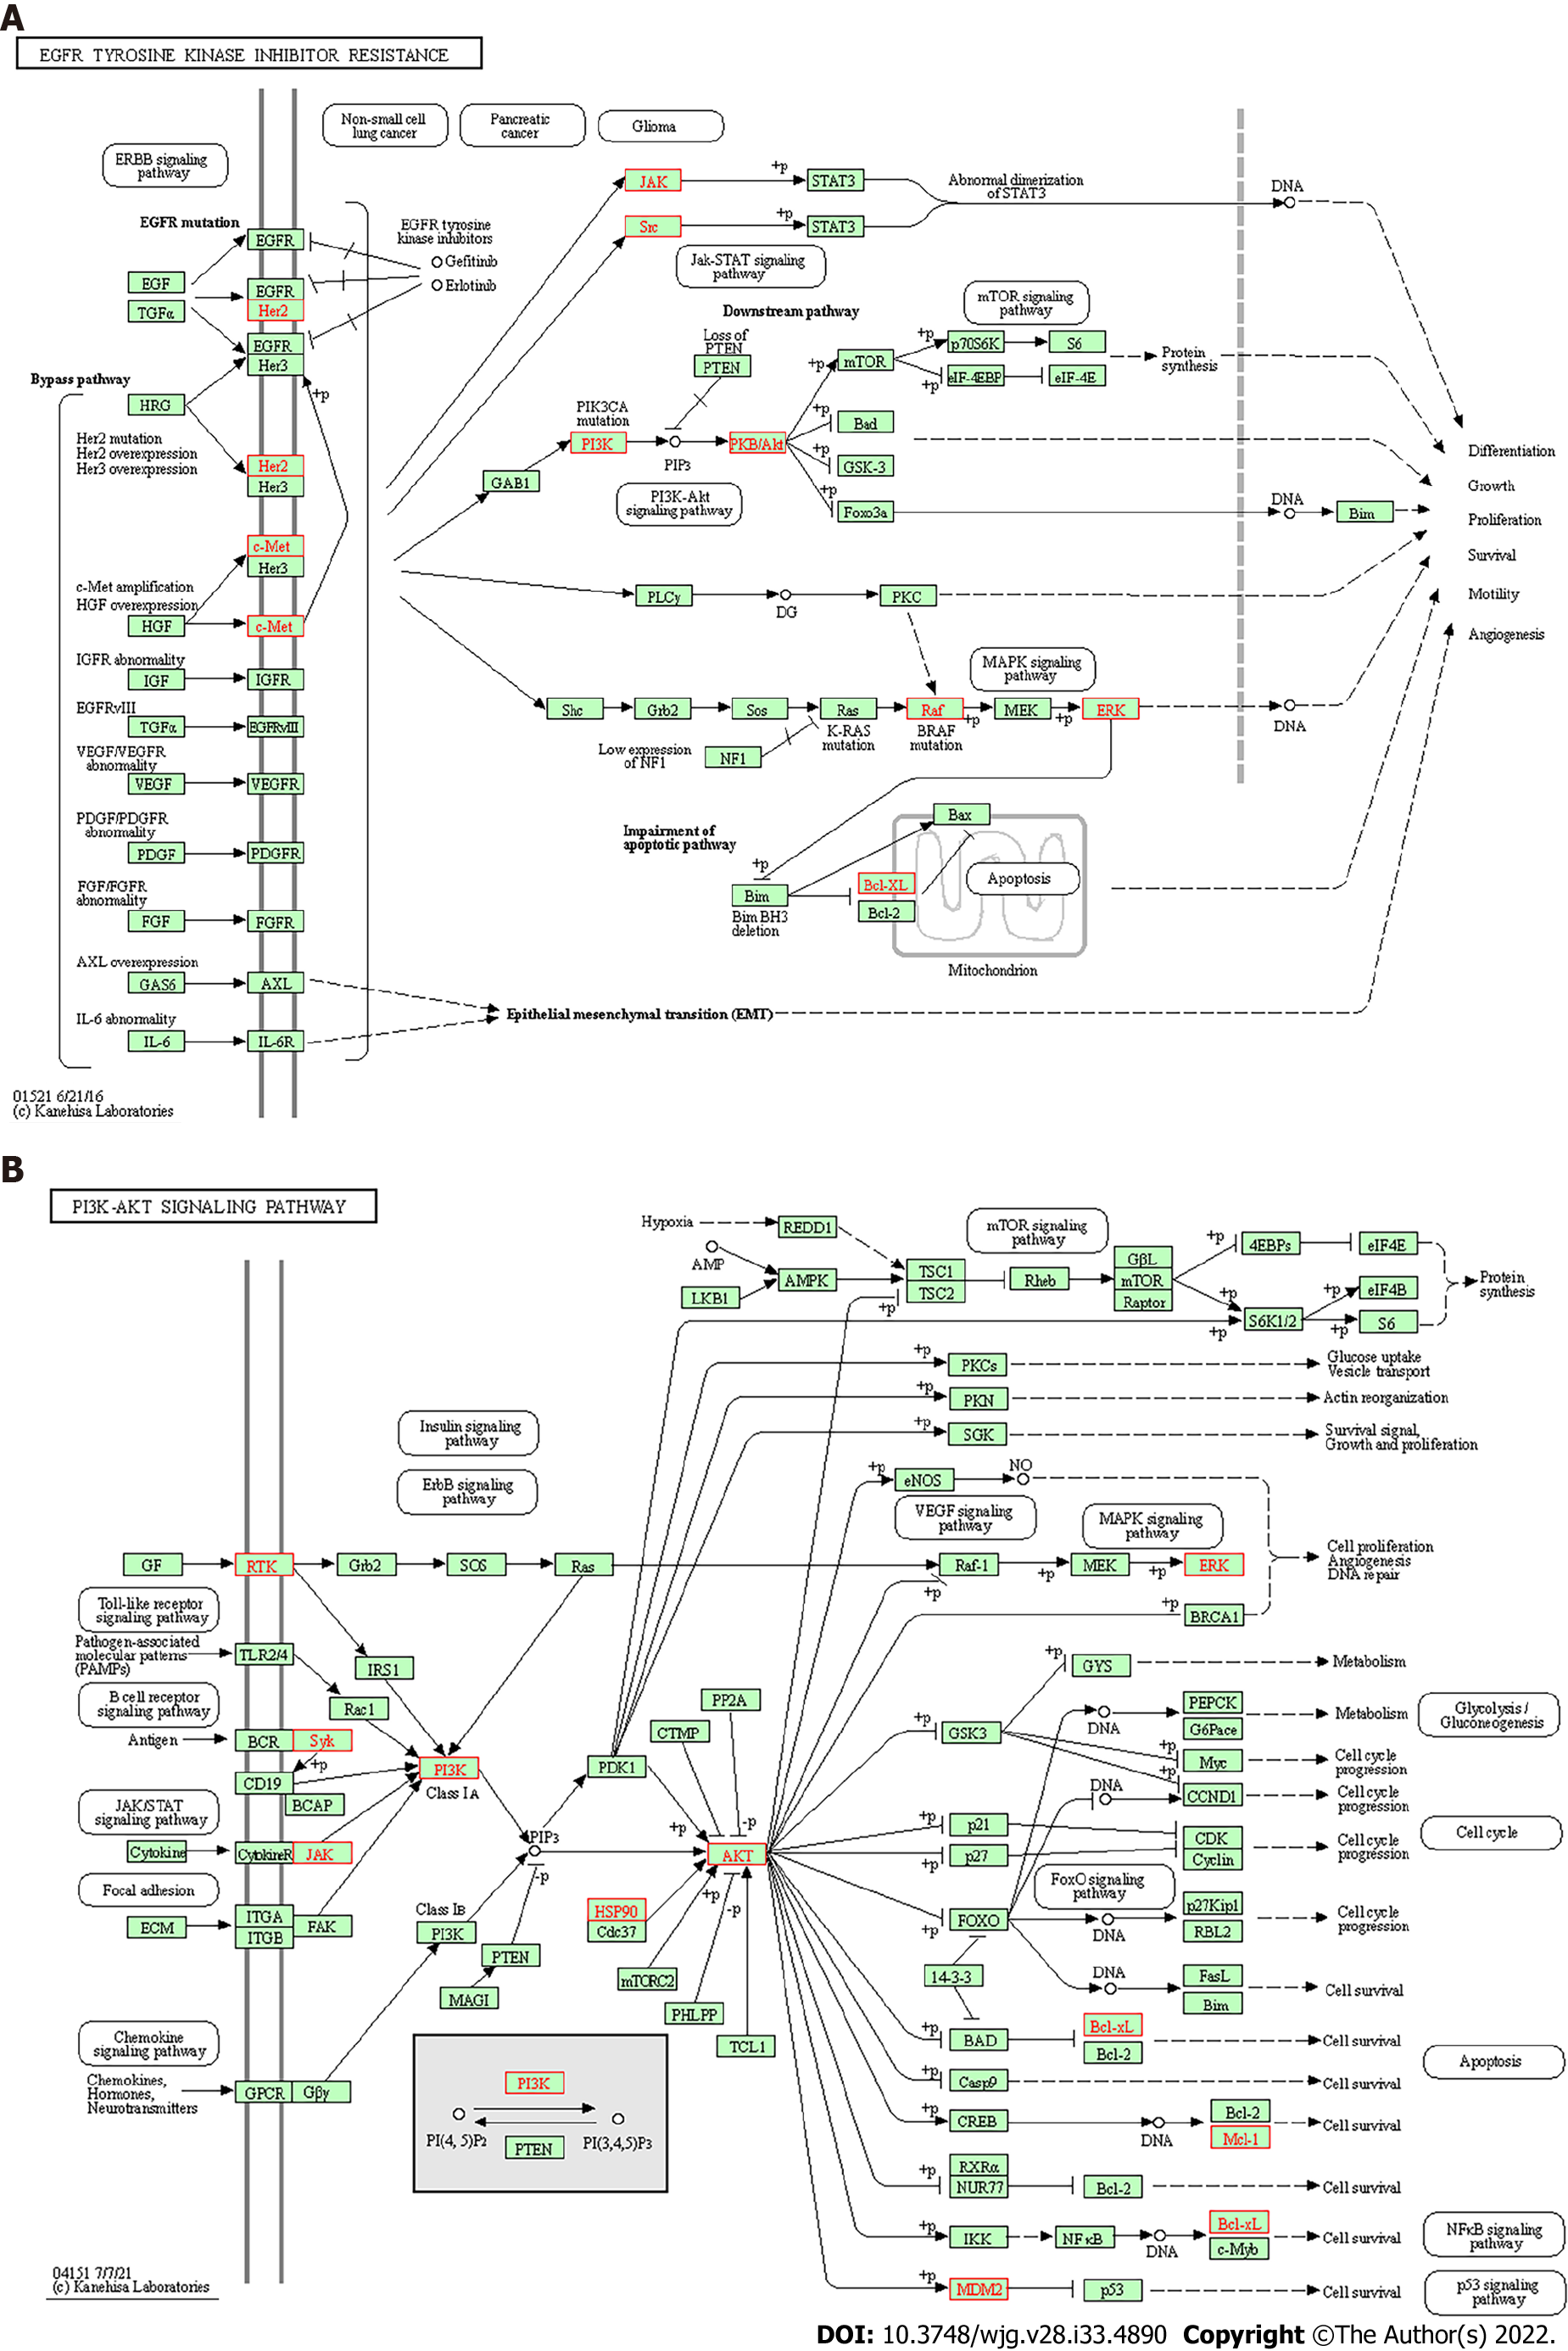
Figure 6 Schematic diagram.
A: Schematic diagram of main Kyoto Encyclopedia of Genes and Genomes (KEGG) pathway, EGFR tyrosine kinase inhibitor resistance; B: Schematic diagram of the main KEGG pathways, PI3K-AKT signaling pathway, arrows represent activation effect, T-arrows represent inhibition effect, and segments show activation or inhibition effects.
- Citation: Jin W, Zhong J, Song Y, Li MF, Song SY, Li CR, Hou WW, Li QJ. Chinese herbal formula shen-ling-bai-zhu-san to treat chronic gastritis: Clinical evidence and potential mechanisms. World J Gastroenterol 2022; 28(33): 4890-4908
- URL: https://www.wjgnet.com/1007-9327/full/v28/i33/4890.htm
- DOI: https://dx.doi.org/10.3748/wjg.v28.i33.4890


