Copyright
©The Author(s) 2022.
World J Gastroenterol. Sep 7, 2022; 28(33): 4787-4811
Published online Sep 7, 2022. doi: 10.3748/wjg.v28.i33.4787
Published online Sep 7, 2022. doi: 10.3748/wjg.v28.i33.4787
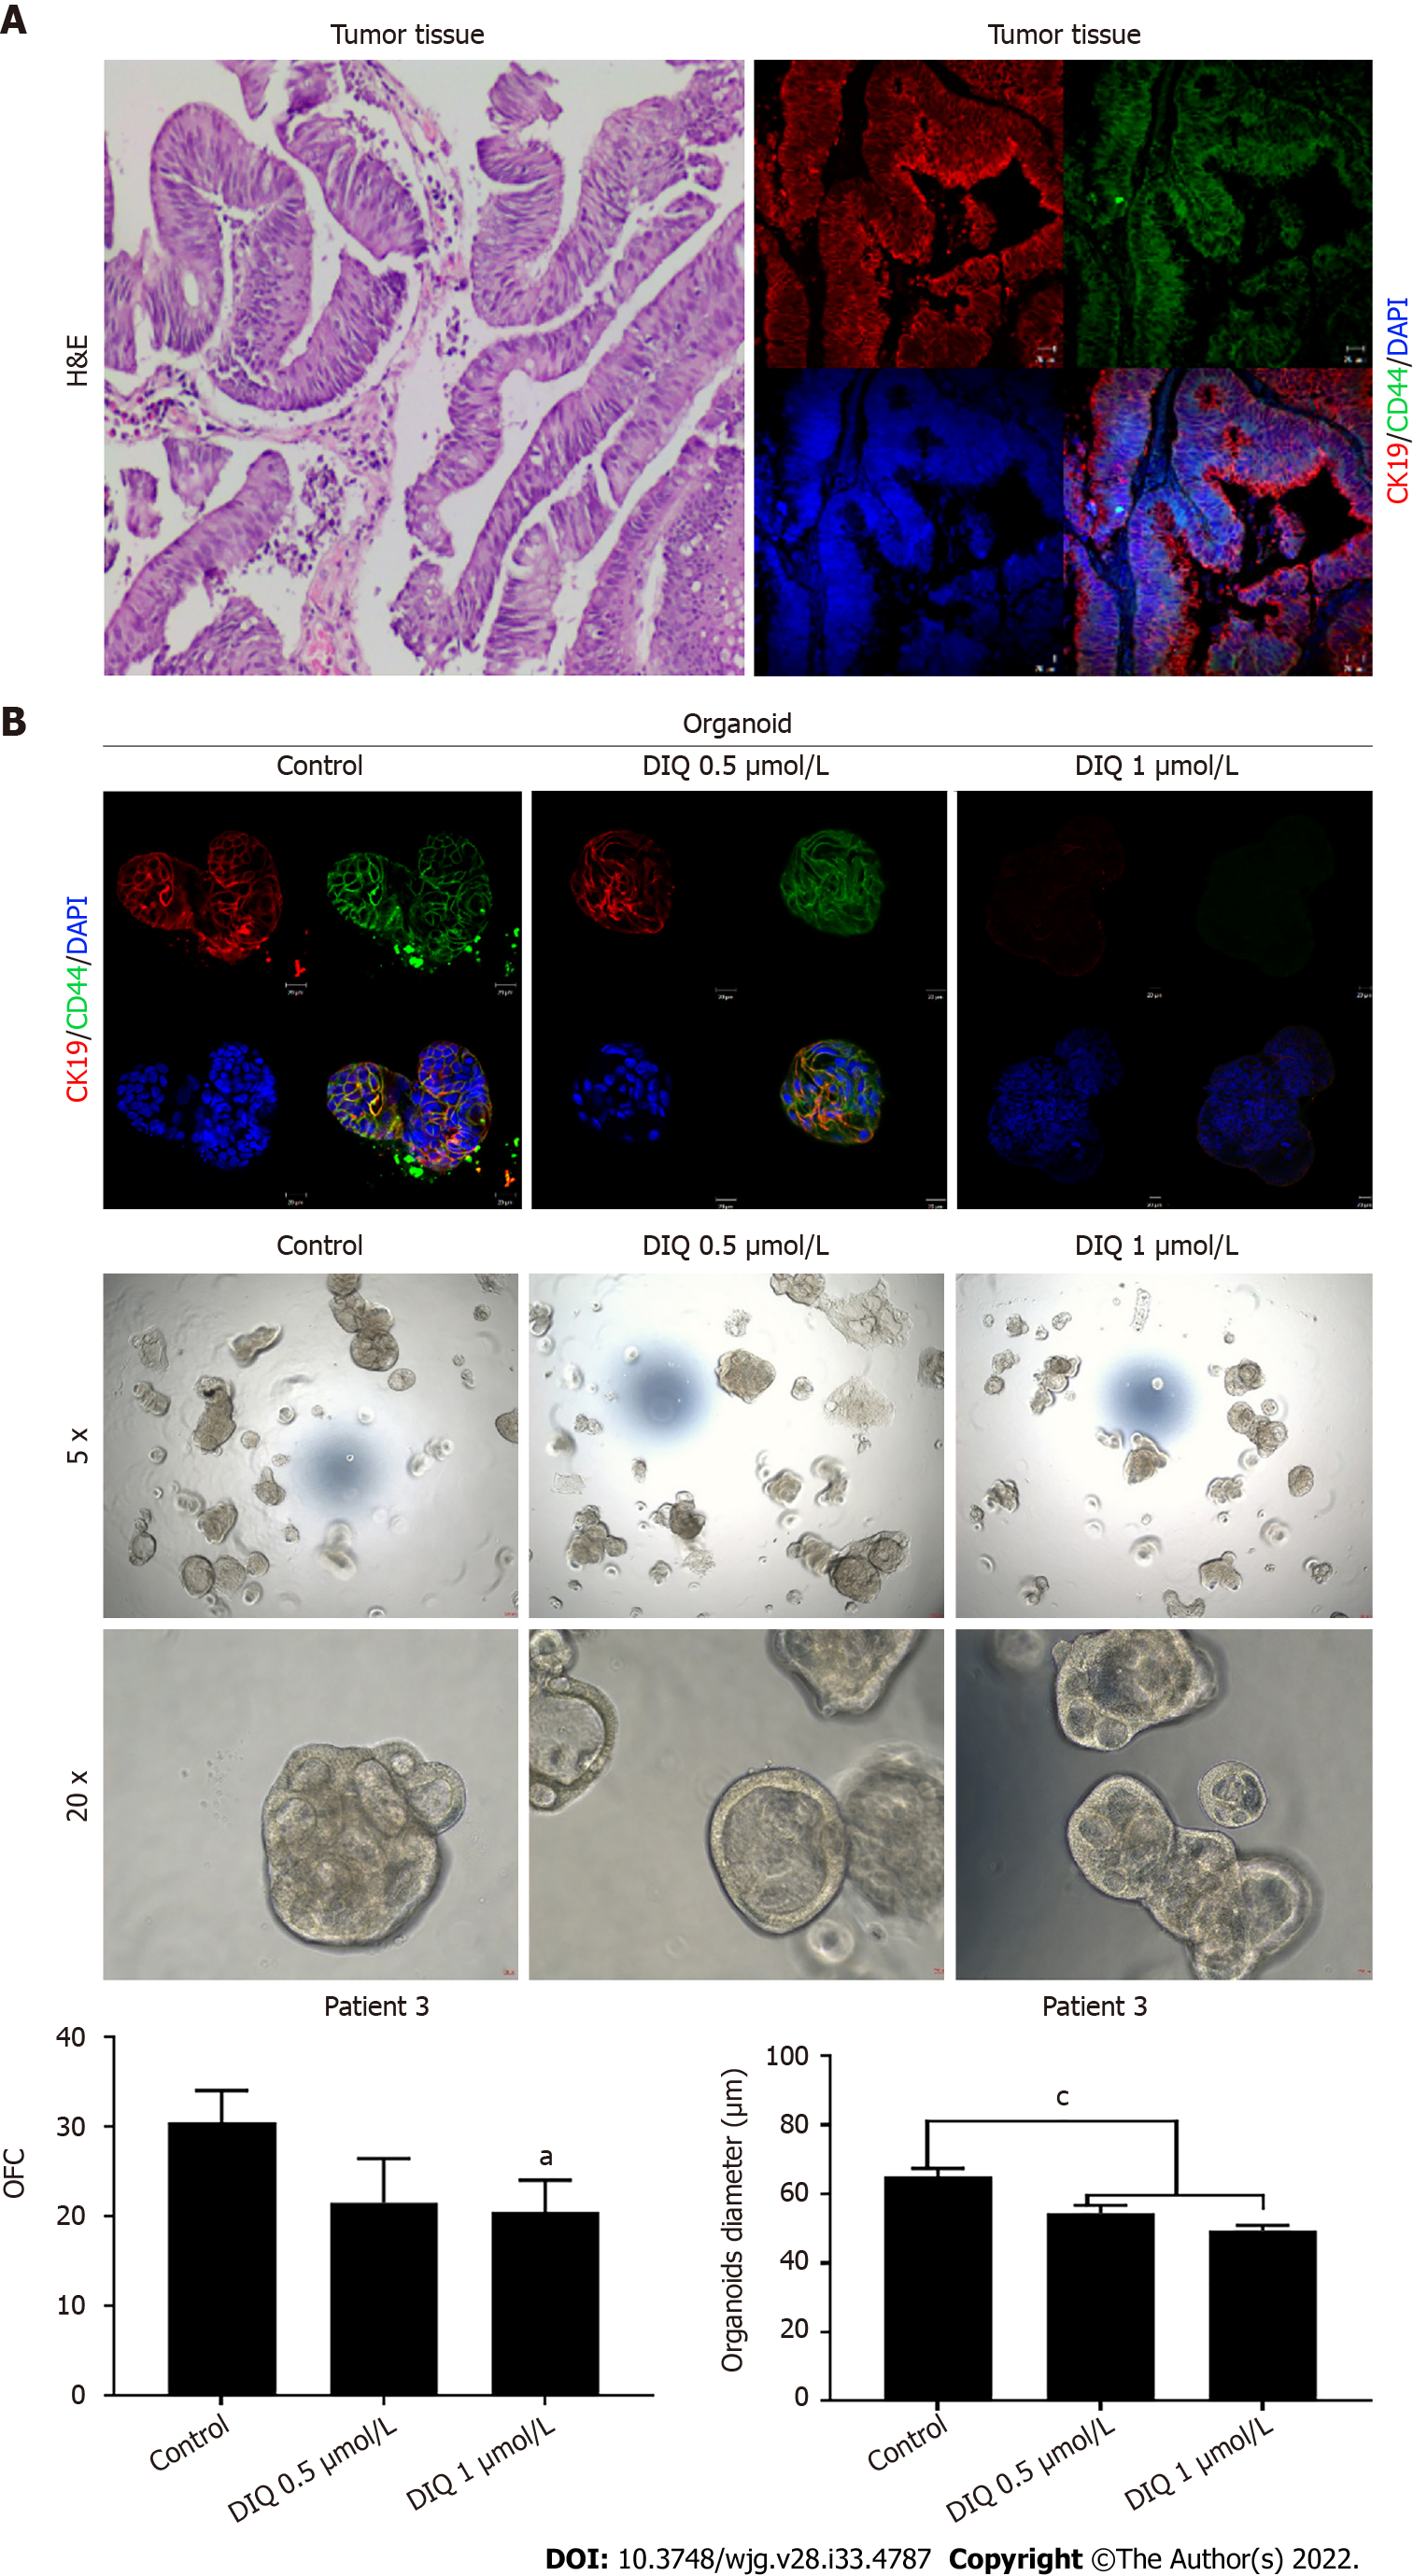
Figure 9 Effect of diiminoquinone on established patient-derived organoids from colon cancer patient 3.
A: Immunohistochemistry images of tissue derived from patient 3 stained with hematoxylin and eosin (HE). Immunofluorescent images of tissue stained with colon lineage epithelial markers cytokeratin (CK)19 and stem cell marker CD44. The nuclei were stained with anti-fade Fluorogel II with 4’, 6-diamidino-2-phenylindole (DAPI). Representative confocal microscopy images were acquired using a Zeiss LSM 710 laser scanning confocal microscope. Scale bar 20 μm; B: Immunofluorescent images of organoids derived from colon cancer patient 3 at generation (G)2 in the presence and absence of diiminoquinone (DIQ) treatment (0.5 and 1 μmol/L) stained with colon lineage epithelial markers CK19 and stem cell marker CD44. The nuclei were stained with anti-fade Fluorogel II with DAPI. Representative confocal microscopy images were acquired using a Zeiss LSM 710 laser scanning confocal microscope. Scale bar 20 μm. Representative bright-field images of organoids derived from colon cancer patient 3 at G2 in the presence and absence of DIQ treatment (0.5 and 1 μmol/L). Organoid formation count and size were calculated, and mean values were reported as mean ± standard error of the mean (aP < 0.05, bP < 0.01, cP < 0.001). Images were visualized by Axiovert inverted microscope at × 5 and × 20 magnification. Organoid formation count (OFC) and size of G were calculated, and mean values were reported as mean ± standard error of the mean (aP < 0.05, bP < 0.01, cP < 0.001). Scale bar 100 μm.
- Citation: Monzer A, Wakimian K, Ballout F, Al Bitar S, Yehya A, Kanso M, Saheb N, Tawil A, Doughan S, Hussein M, Mukherji D, Faraj W, Gali-Muhtasib H, Abou-Kheir W. Novel therapeutic diiminoquinone exhibits anticancer effects on human colorectal cancer cells in two-dimensional and three-dimensional in vitro models. World J Gastroenterol 2022; 28(33): 4787-4811
- URL: https://www.wjgnet.com/1007-9327/full/v28/i33/4787.htm
- DOI: https://dx.doi.org/10.3748/wjg.v28.i33.4787


