Copyright
©The Author(s) 2022.
World J Gastroenterol. Sep 7, 2022; 28(33): 4787-4811
Published online Sep 7, 2022. doi: 10.3748/wjg.v28.i33.4787
Published online Sep 7, 2022. doi: 10.3748/wjg.v28.i33.4787
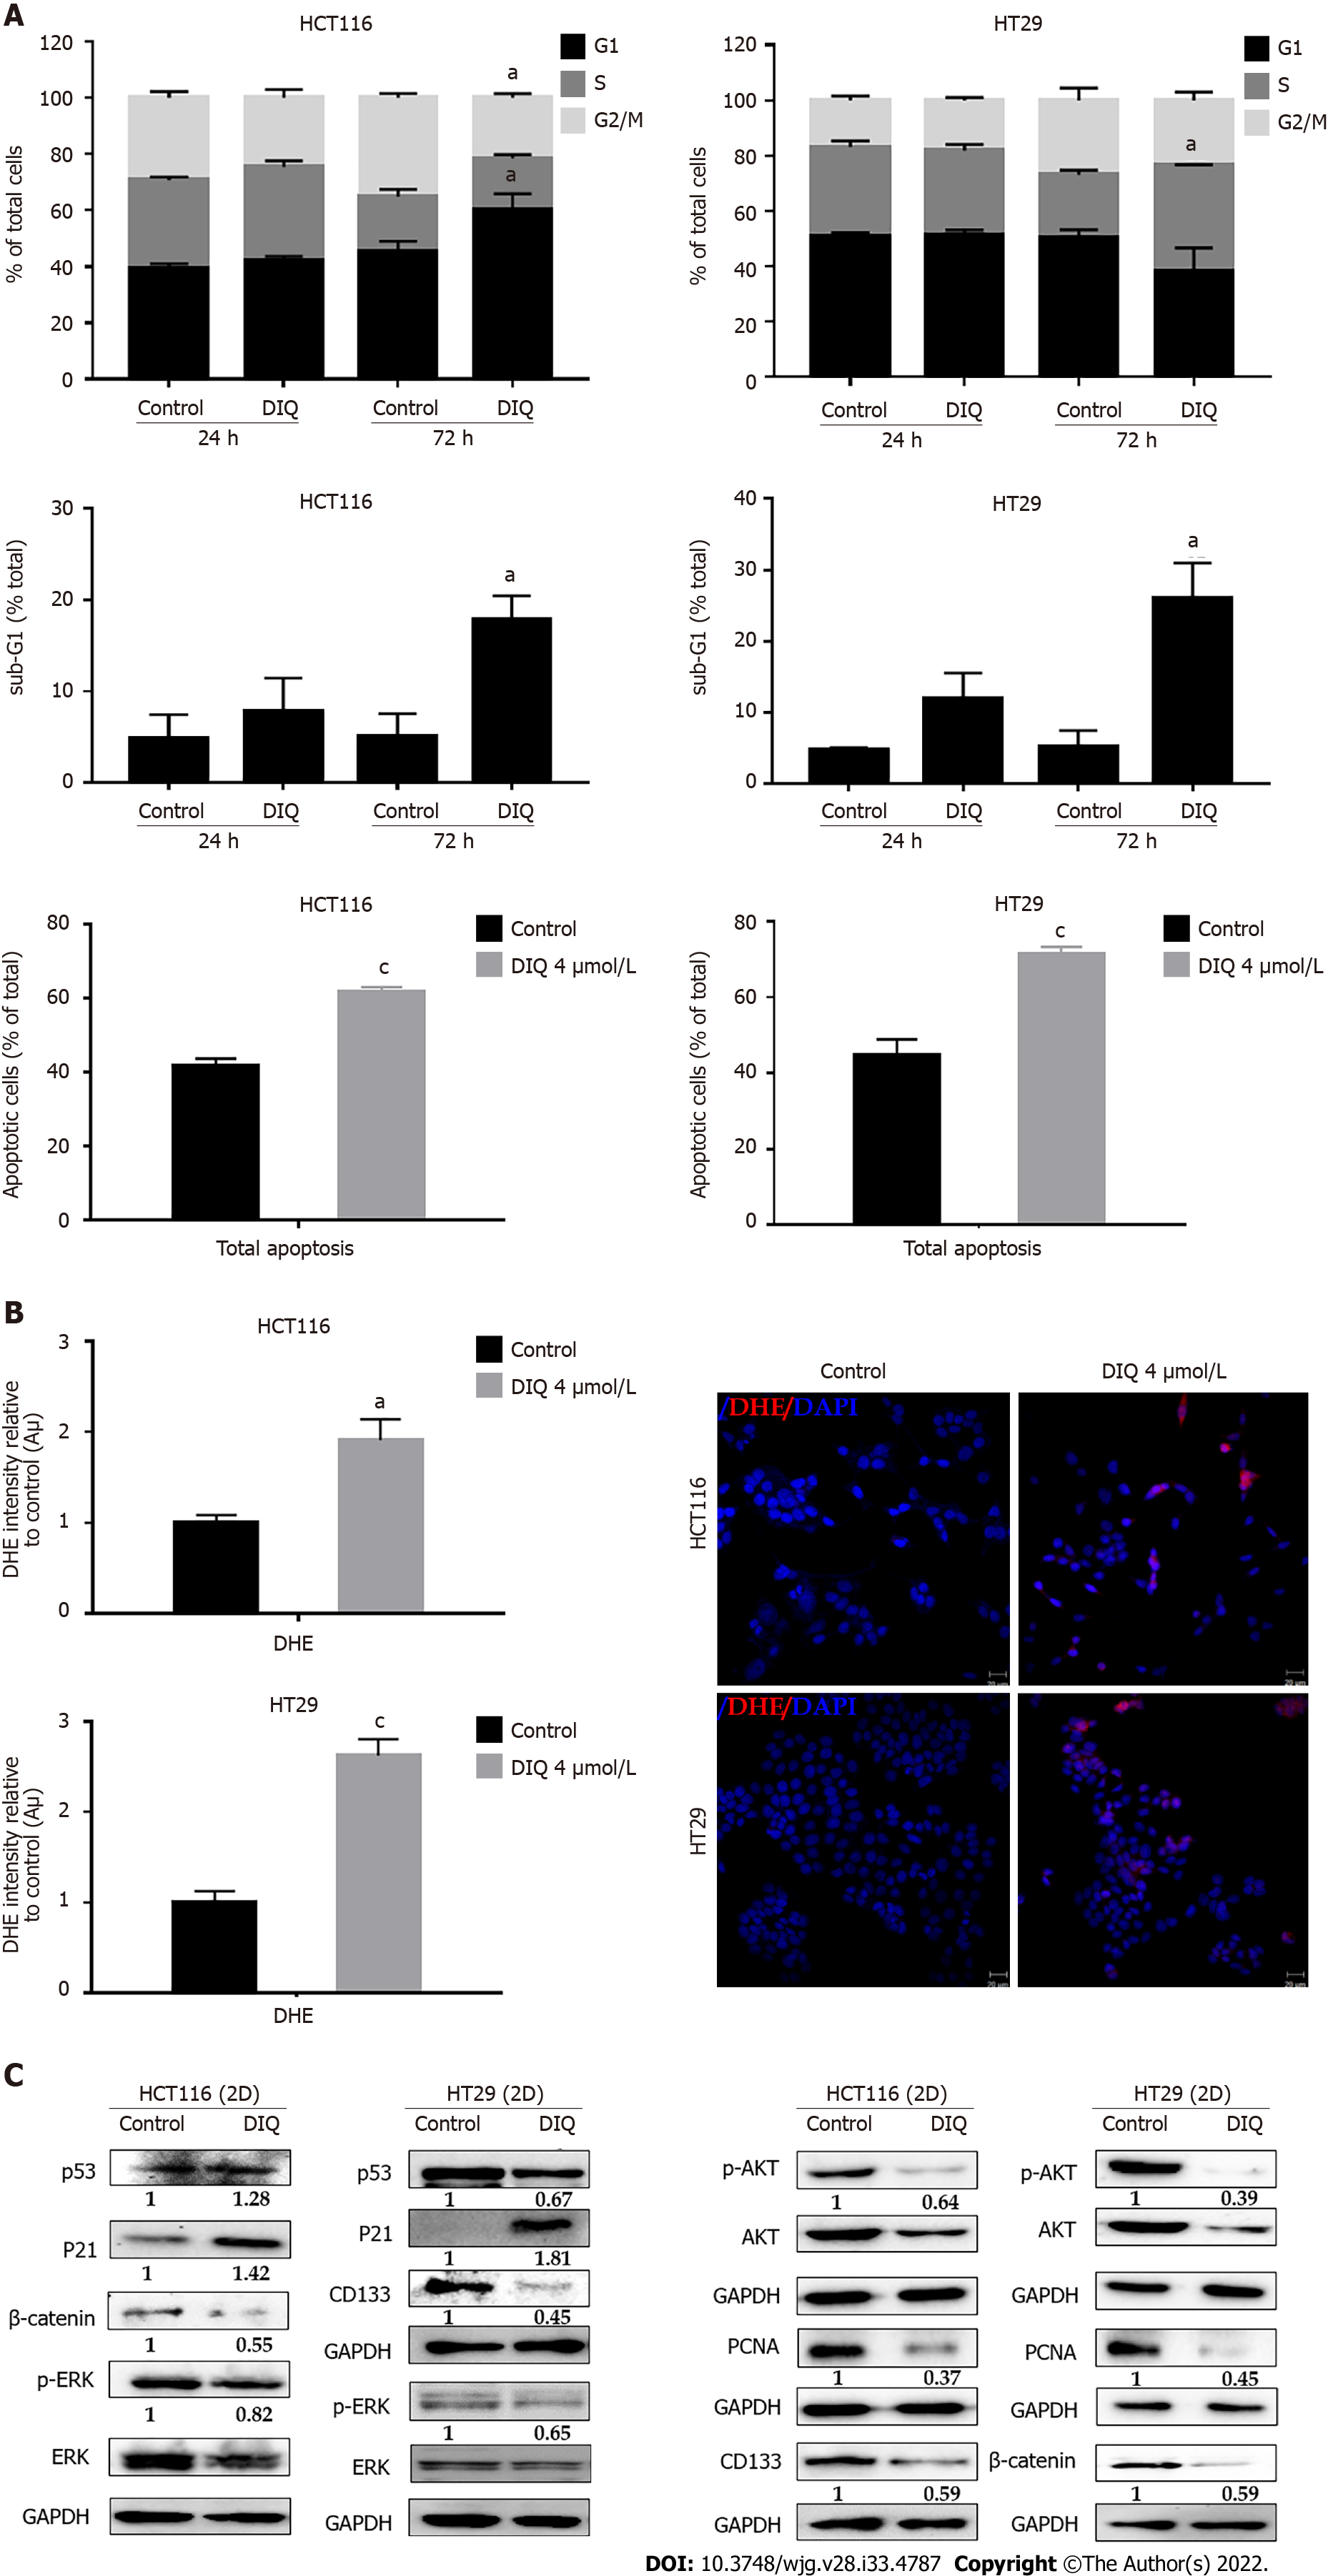
Figure 4 Diiminoquinone induced an accumulation of HCT116 and HT29 cancer cells in the sub-G1 region and apoptosis along with an increase in reactive oxygen species production.
A: The distribution of phases of the cell cycle upon diiminoquinone (DIQ) treatment at 24 h and 72 h in HCT116 and HT29 cells using propidium iodide-based flow cytometric analysis of DNA content was shown. Data represent the average of three independent experiments and are reported as mean ± standard error of the mean (aP < 0.05, bP < 0.01, cP < 0.001); B: Reactive oxygen species (ROS) production in HCT116 and HT29 cells was detected by dihydroethidium (DHE) staining. Representative images of colorectal cancer cells exposed to DIQ stained with DHE for ROS content (red color). Cell nuclei were stained with 4’,6-diamidino-2-phenylindole (DAPI) (blue). A summary of the quantification of the red fluorescence intensity was represented; C: Lysates of colorectal cancer cells treated with 4 μmol/L DIQ were immunoblotted for p53, p21, β-catenin, p-ERK, ERK, p-AKT, AKT, and proliferating cell nuclear antigen (PCNA). Bands were detected by enhanced chemiluminescence and quantified using ChemiDoc MP Imaging System. Data represent an average of three independent experiments and is reported as mean ± standard error of the mean (aP < 0.05, bP < 0.01, cP < 0.001).
- Citation: Monzer A, Wakimian K, Ballout F, Al Bitar S, Yehya A, Kanso M, Saheb N, Tawil A, Doughan S, Hussein M, Mukherji D, Faraj W, Gali-Muhtasib H, Abou-Kheir W. Novel therapeutic diiminoquinone exhibits anticancer effects on human colorectal cancer cells in two-dimensional and three-dimensional in vitro models. World J Gastroenterol 2022; 28(33): 4787-4811
- URL: https://www.wjgnet.com/1007-9327/full/v28/i33/4787.htm
- DOI: https://dx.doi.org/10.3748/wjg.v28.i33.4787


