Copyright
©The Author(s) 2022.
World J Gastroenterol. Aug 28, 2022; 28(32): 4726-4740
Published online Aug 28, 2022. doi: 10.3748/wjg.v28.i32.4726
Published online Aug 28, 2022. doi: 10.3748/wjg.v28.i32.4726
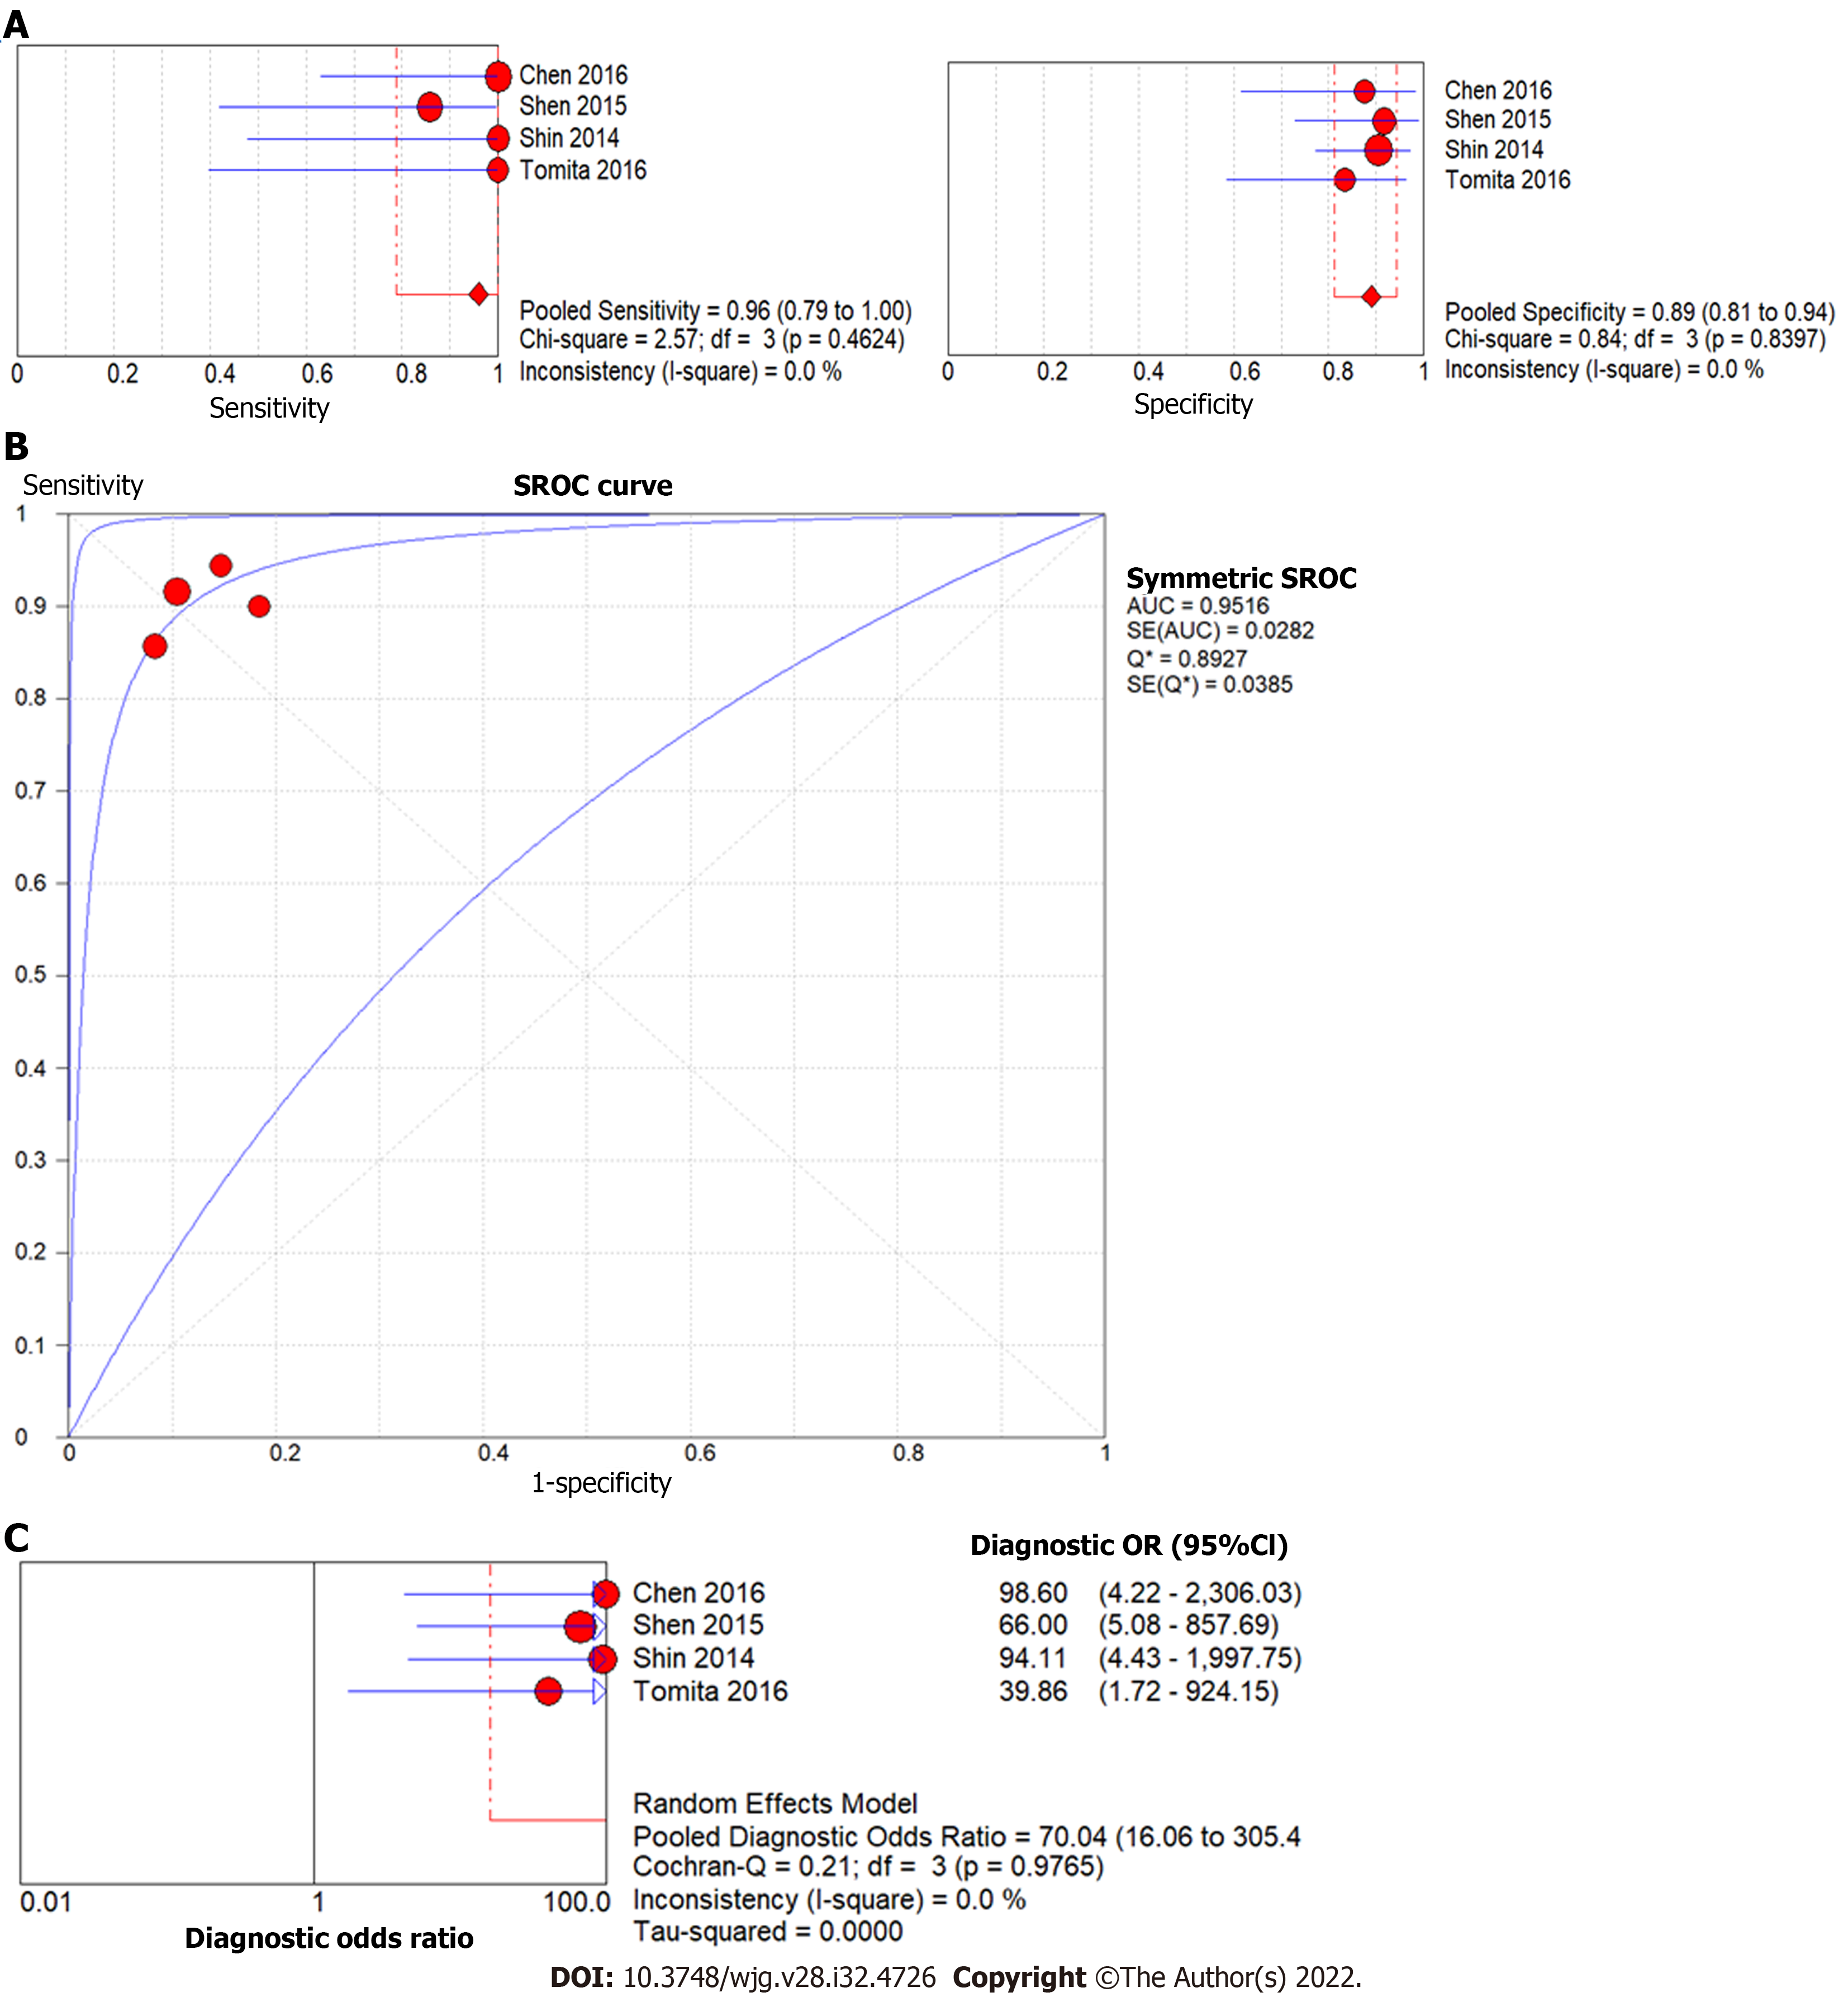
Figure 7 Forest plot of liver stiffness value measured by shear wave elastography to predict the presence of liver fibrosis F4 (vs F0-3) in post-Kasai patients.
A: Diagnostic sensitivity and specificity; B: Summary receiver operating characteristic curve; C: Diagnostic odds ratio.
- Citation: Wagner ES, Abdelgawad HAH, Landry M, Asfour B, Slidell MB, Azzam R. Use of shear wave elastography for the diagnosis and follow-up of biliary atresia: A meta-analysis. World J Gastroenterol 2022; 28(32): 4726-4740
- URL: https://www.wjgnet.com/1007-9327/full/v28/i32/4726.htm
- DOI: https://dx.doi.org/10.3748/wjg.v28.i32.4726


