Copyright
©The Author(s) 2022.
World J Gastroenterol. Aug 28, 2022; 28(32): 4726-4740
Published online Aug 28, 2022. doi: 10.3748/wjg.v28.i32.4726
Published online Aug 28, 2022. doi: 10.3748/wjg.v28.i32.4726
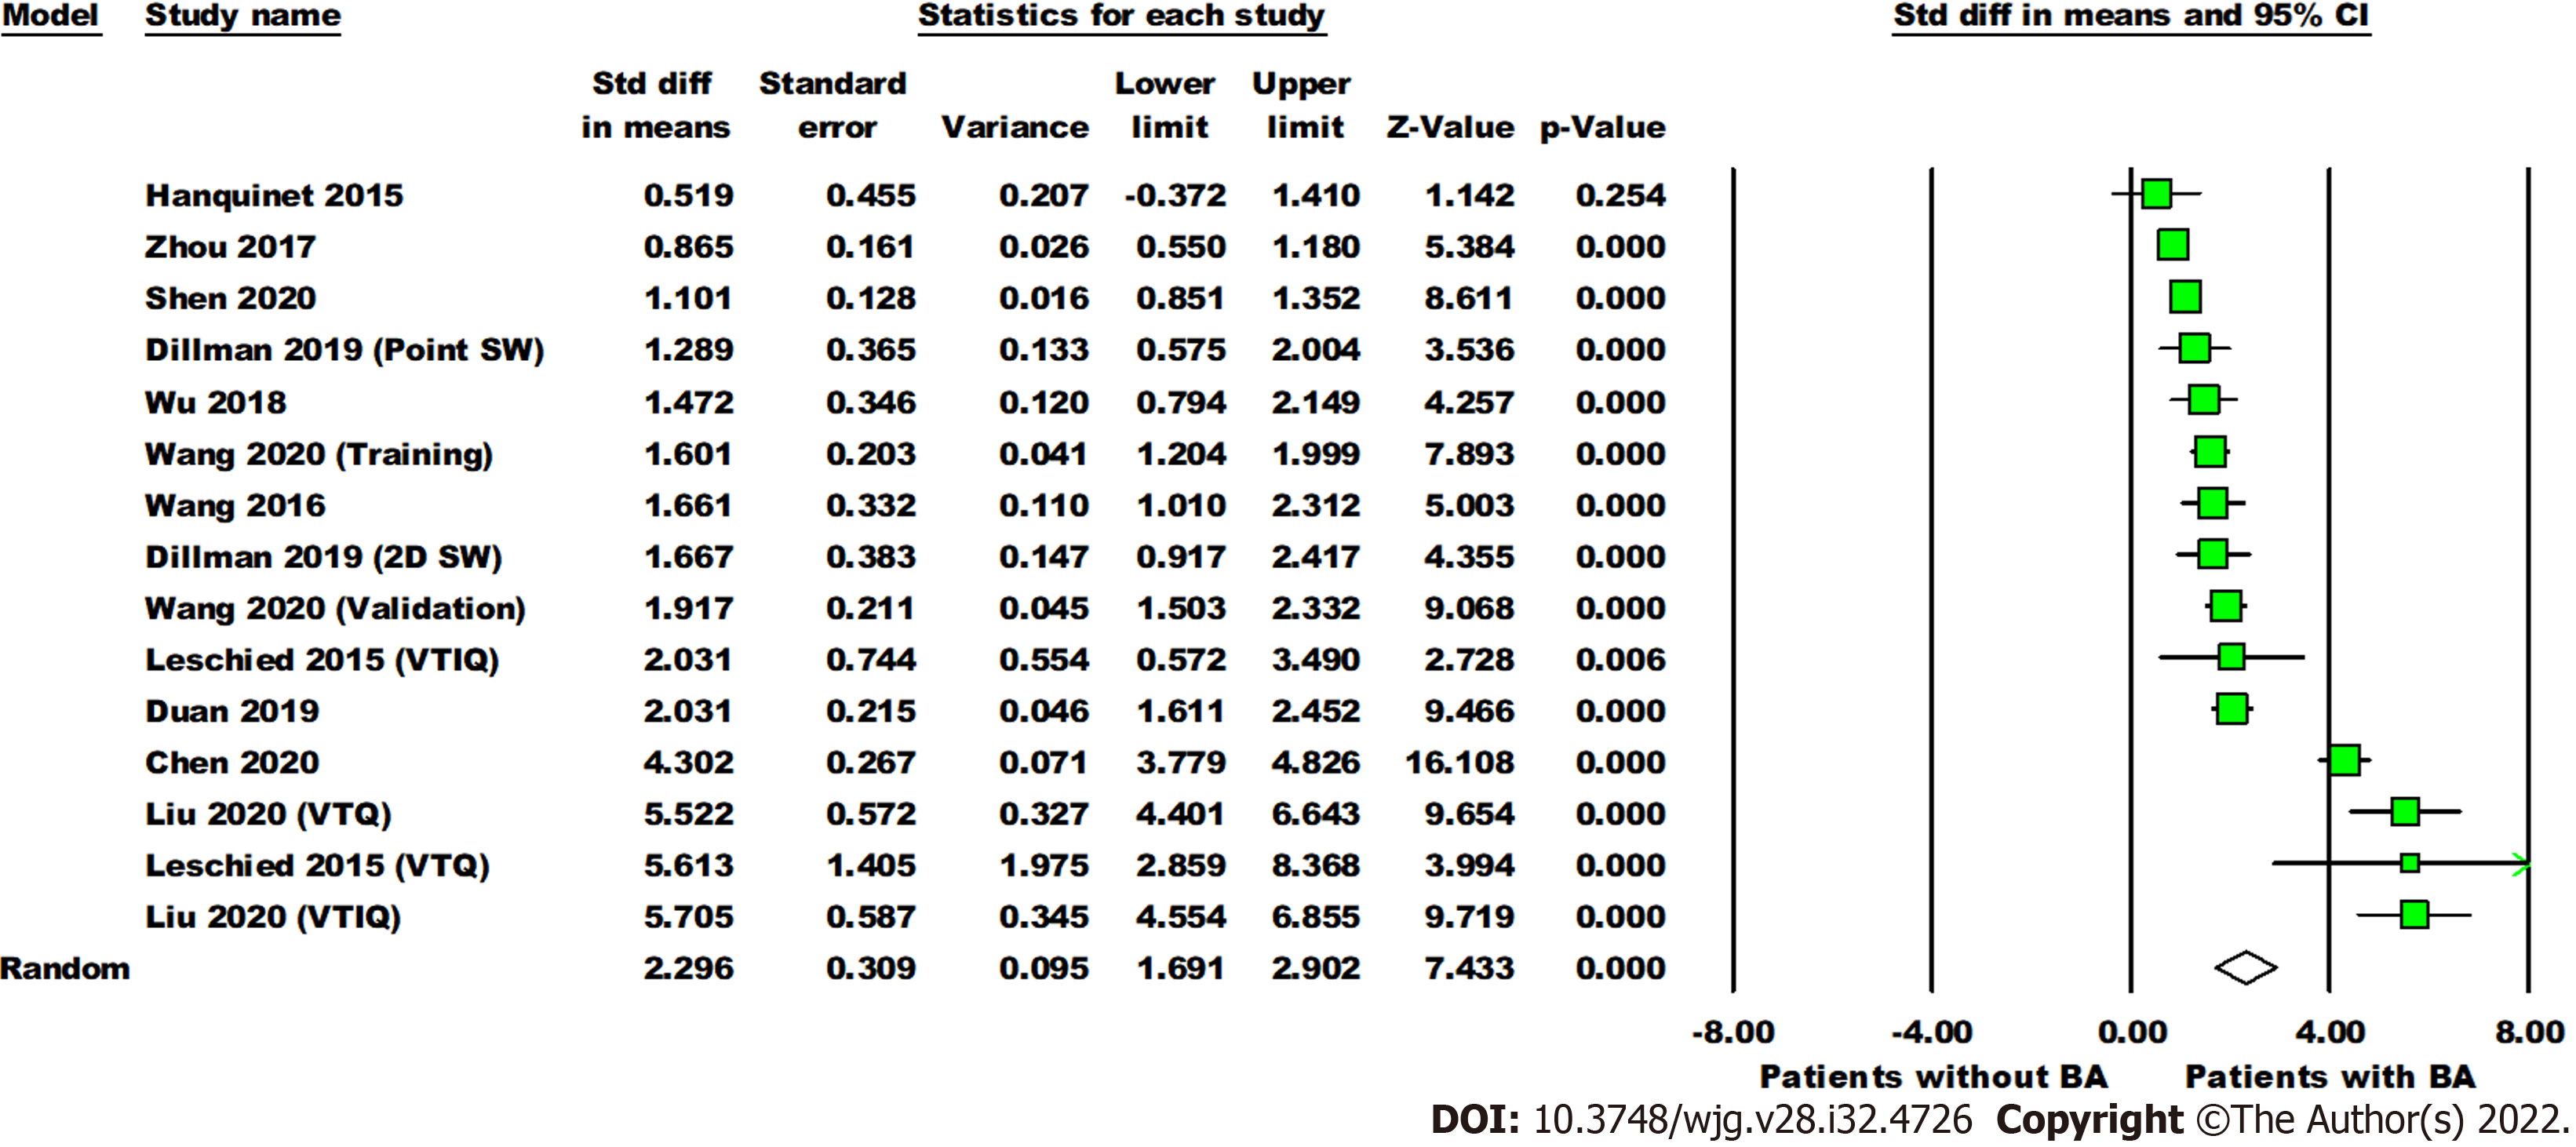
Figure 3 Forest plot comparing the liver stiffness value (Kpa) between the patients with and without biliary atresia.
Dillman, Wang (2020), Leschied, and Liu each have multiple analyses due to different shear wave elastography modes and/or phases of study (training, validation). Point SW: Point shear wave elastography; 2D SW: Two-dimensional shear wave elastography; VTIQ: Virtual touch IQ, alternative nomenclature for two-dimensional shear wave elastography; VTQ: Virtual touch quantification, alternative nomenclature for point shear wave elastography.
- Citation: Wagner ES, Abdelgawad HAH, Landry M, Asfour B, Slidell MB, Azzam R. Use of shear wave elastography for the diagnosis and follow-up of biliary atresia: A meta-analysis. World J Gastroenterol 2022; 28(32): 4726-4740
- URL: https://www.wjgnet.com/1007-9327/full/v28/i32/4726.htm
- DOI: https://dx.doi.org/10.3748/wjg.v28.i32.4726


