Copyright
©The Author(s) 2022.
World J Gastroenterol. Aug 28, 2022; 28(32): 4649-4667
Published online Aug 28, 2022. doi: 10.3748/wjg.v28.i32.4649
Published online Aug 28, 2022. doi: 10.3748/wjg.v28.i32.4649
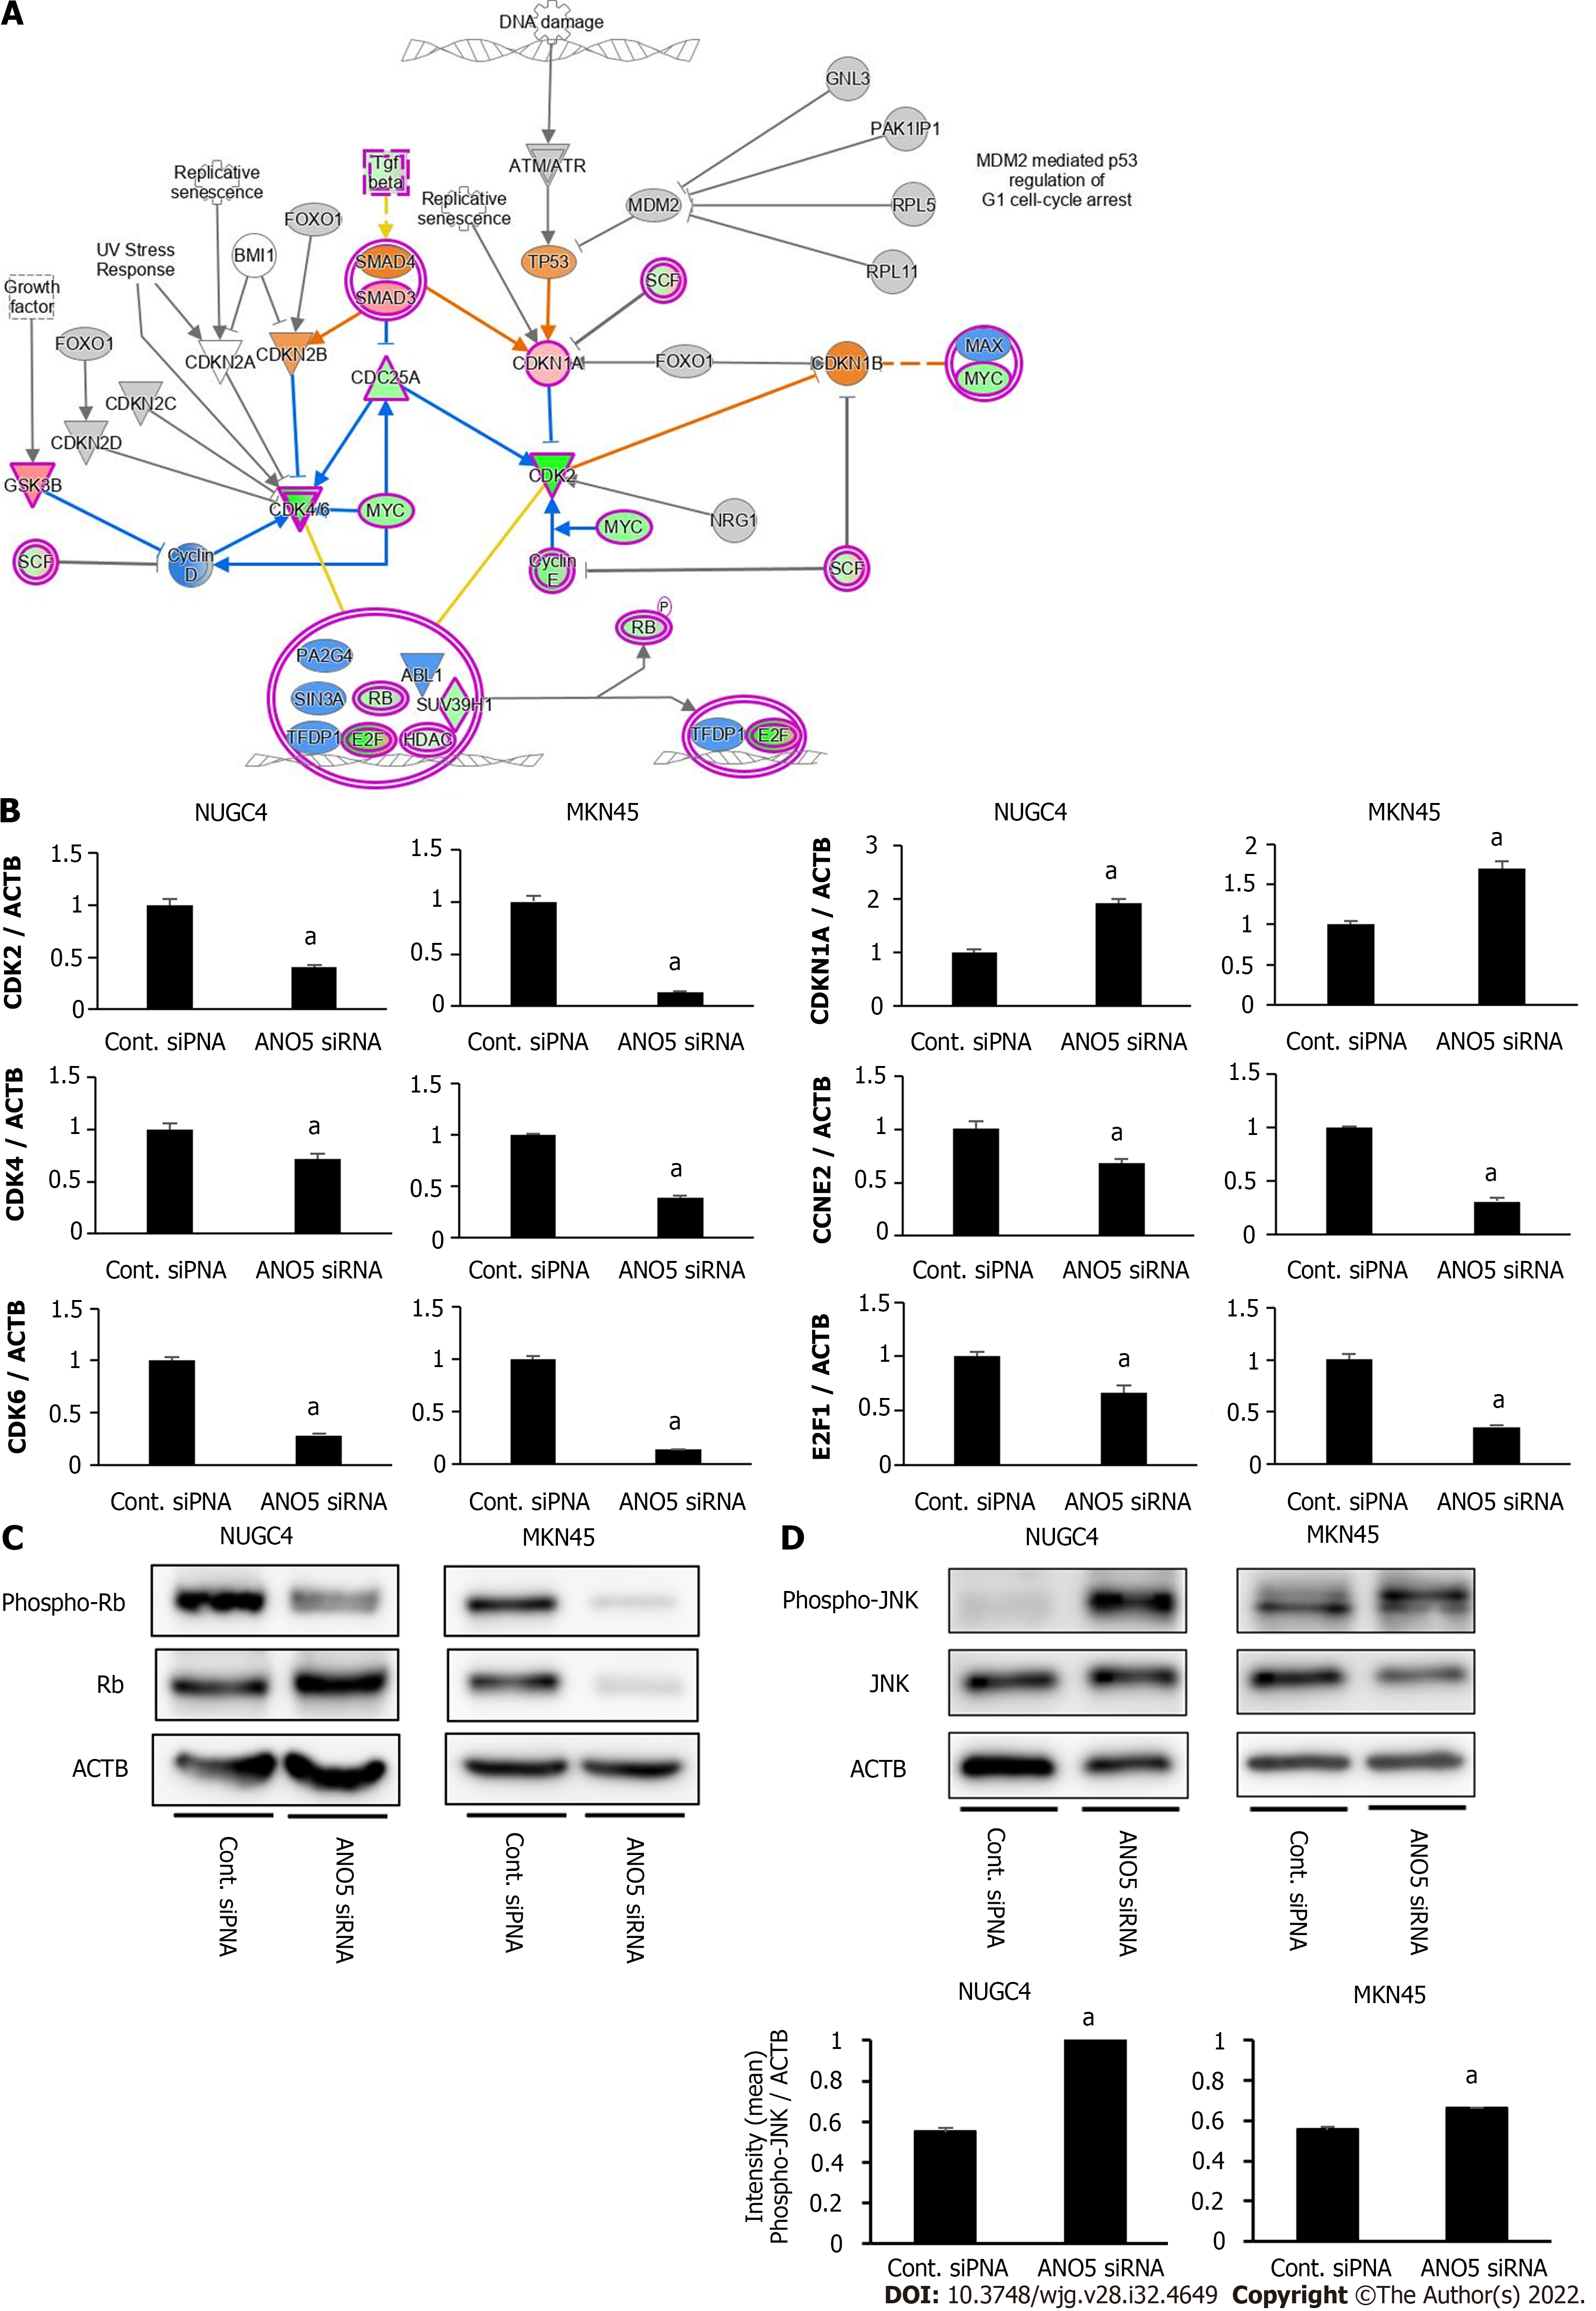
Figure 4 Network analyses by microarray analysis and ingenuity pathway analysis.
A: The signaling map of “Cell Cycle: G1/S Checkpoint Regulation,” one of the top-ranked canonical pathways related to the depletion of anoctamin 5 (ANO5) according to ingenuity pathway analysis. Red and green colors indicate genes with expression levels that were higher or lower, respectively, than reference RNA levels; B: To verify gene expression profiling data, CDK2, CDK4, CDK6, CDKN1A, CCNE2, and E2F1 were examined by real-time reverse transcription-quantitative polymerase chain reaction. The downregulation of ANO5 effectively reduced CDK2, CDK4, CDK6, CCNE2, and E2F1 mRNA levels and increased CDKN1A/p21 mRNA levels in NUGC4 and MKN45 cells; C: The downregulation of ANO5 effectively reduced the phosphorylation levels of Rb protein in NUGC4 and MKN45 cells; D: The downregulation of ANO5 increased the phosphorylation of the c-Jun N-terminal kinase protein in NUGC4 and MKN45 cells. n = 3, mean ± standard error of the mean. aP < 0.05 (significantly different from control small interfering RNA). ANO5: Anoctamin 5; siRNA: Small interfering RNA; Cont.: Control; JNK: c-Jun N-terminal kinase; ACTB: β-actin.
- Citation: Fukami T, Shiozaki A, Kosuga T, Kudou M, Shimizu H, Ohashi T, Arita T, Konishi H, Komatsu S, Kubota T, Fujiwara H, Okamoto K, Kishimoto M, Morinaga Y, Konishi E, Otsuji E. Anoctamin 5 regulates the cell cycle and affects prognosis in gastric cancer. World J Gastroenterol 2022; 28(32): 4649-4667
- URL: https://www.wjgnet.com/1007-9327/full/v28/i32/4649.htm
- DOI: https://dx.doi.org/10.3748/wjg.v28.i32.4649


