Copyright
©The Author(s) 2022.
World J Gastroenterol. Aug 28, 2022; 28(32): 4600-4619
Published online Aug 28, 2022. doi: 10.3748/wjg.v28.i32.4600
Published online Aug 28, 2022. doi: 10.3748/wjg.v28.i32.4600
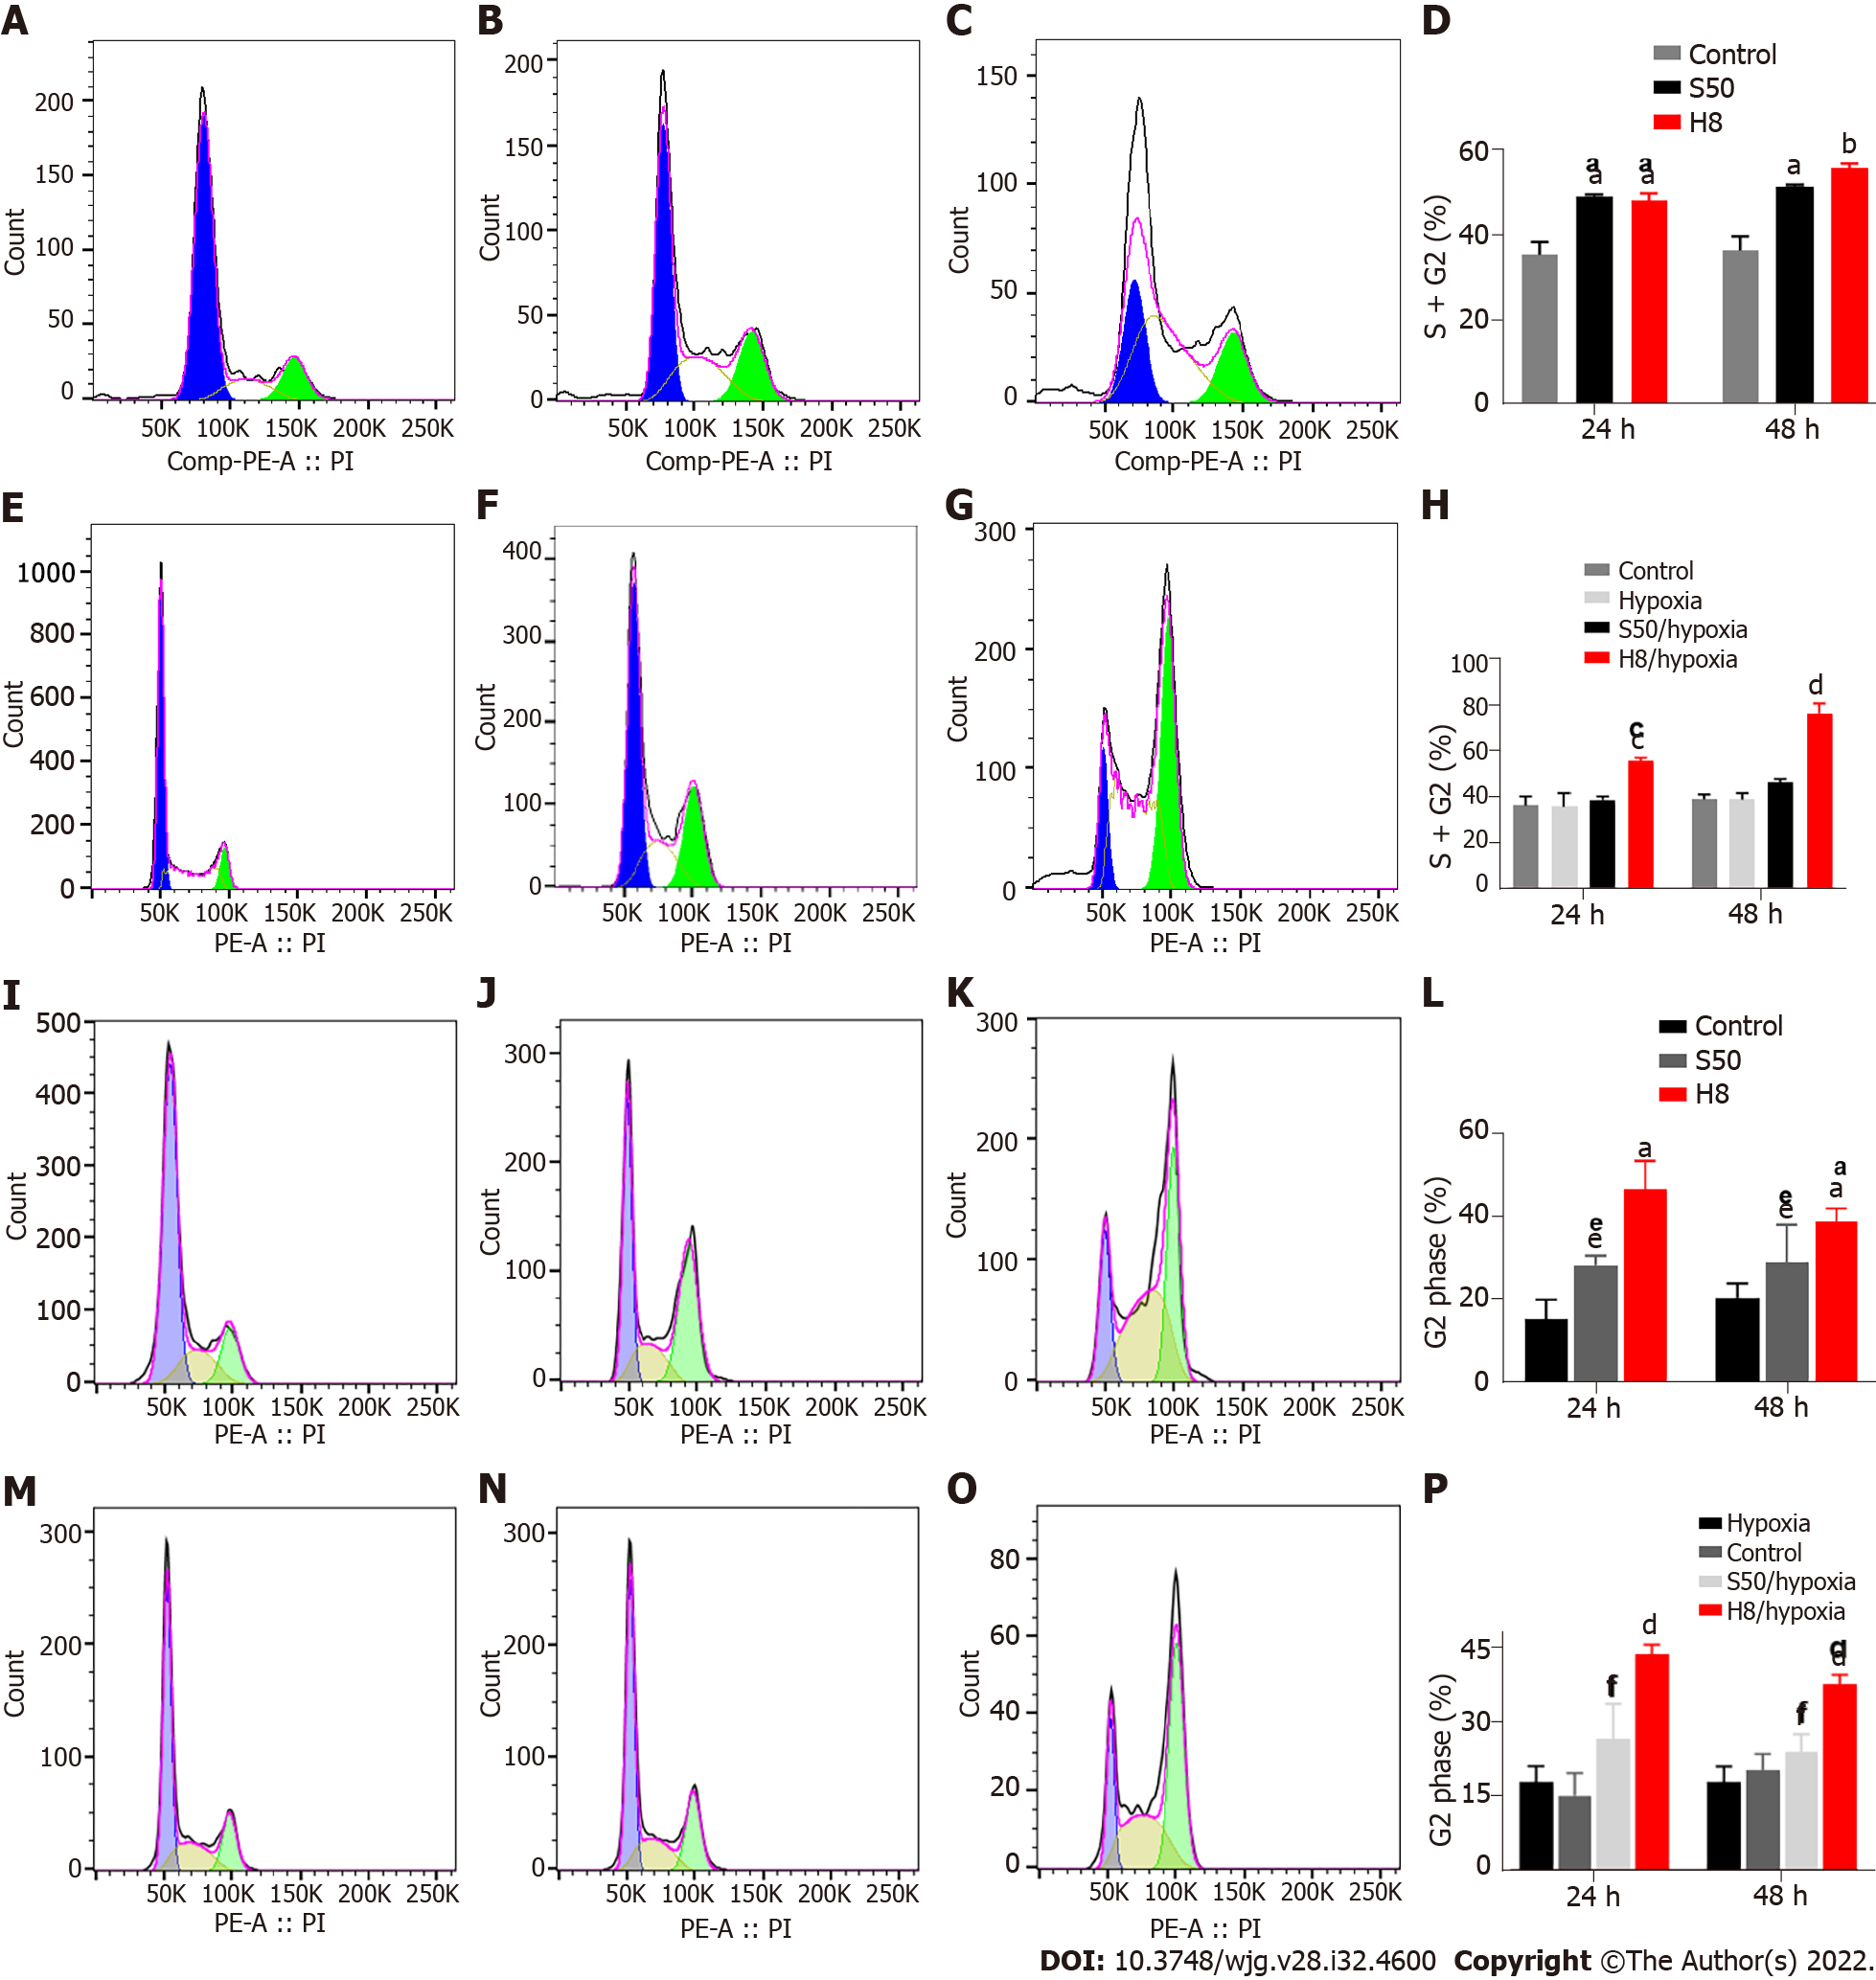
Figure 4 Effects of sirolimus and Huai Er on cell cycle progression of HepG2 and Huh 7 cells under normoxic and hypoxic conditions.
A-C: Peak graphs of apoptosis of control HepG2 cells (A) and those treated with sirolimus (SRL) (B) and Huai Er (C) under normoxia; D: HepG2 cell cycle distribution at 24 h and 48 h under normoxia; E-G: Peak graphs of apoptosis of control HepG2 cells (E) and those treated with SRL (F) and Huai Er (G) under hypoxia; H: HepG2 cell cycle distribution at 24 h and 48 h under hypoxia; I-K: Peak graphs of apoptosis of control Huh 7 cells (I) and those treated with SRL (J) and Huai Er (K) under normoxia; L: Huh 7 cell cycle distribution at 24 h and 48 h under normoxia; M-O: Peak graphs of apoptosis of control Huh 7 cells (M) and those treated with SRL (N) and Huai Er (O) under hypoxia; P: Huh 7 cell cycle distribution at 24 h and 48 h under hypoxia. aP < 0.01 vs control; bP < 0.001 vs control; cP < 0.01 vs hypoxia; dP < 0.001 vs hypoxia; eP < 0.05 vs control; fP < 0.05 vs hypoxia. H8: 8 mg/mL for Huai Er; S50: 50 nM for SRL.
- Citation: Zhou L, Zhao Y, Pan LC, Wang J, Shi XJ, Du GS, He Q. Sirolimus increases the anti-cancer effect of Huai Er by regulating hypoxia inducible factor-1α-mediated glycolysis in hepatocellular carcinoma. World J Gastroenterol 2022; 28(32): 4600-4619
- URL: https://www.wjgnet.com/1007-9327/full/v28/i32/4600.htm
- DOI: https://dx.doi.org/10.3748/wjg.v28.i32.4600


