Copyright
©The Author(s) 2022.
World J Gastroenterol. Aug 28, 2022; 28(32): 4574-4599
Published online Aug 28, 2022. doi: 10.3748/wjg.v28.i32.4574
Published online Aug 28, 2022. doi: 10.3748/wjg.v28.i32.4574
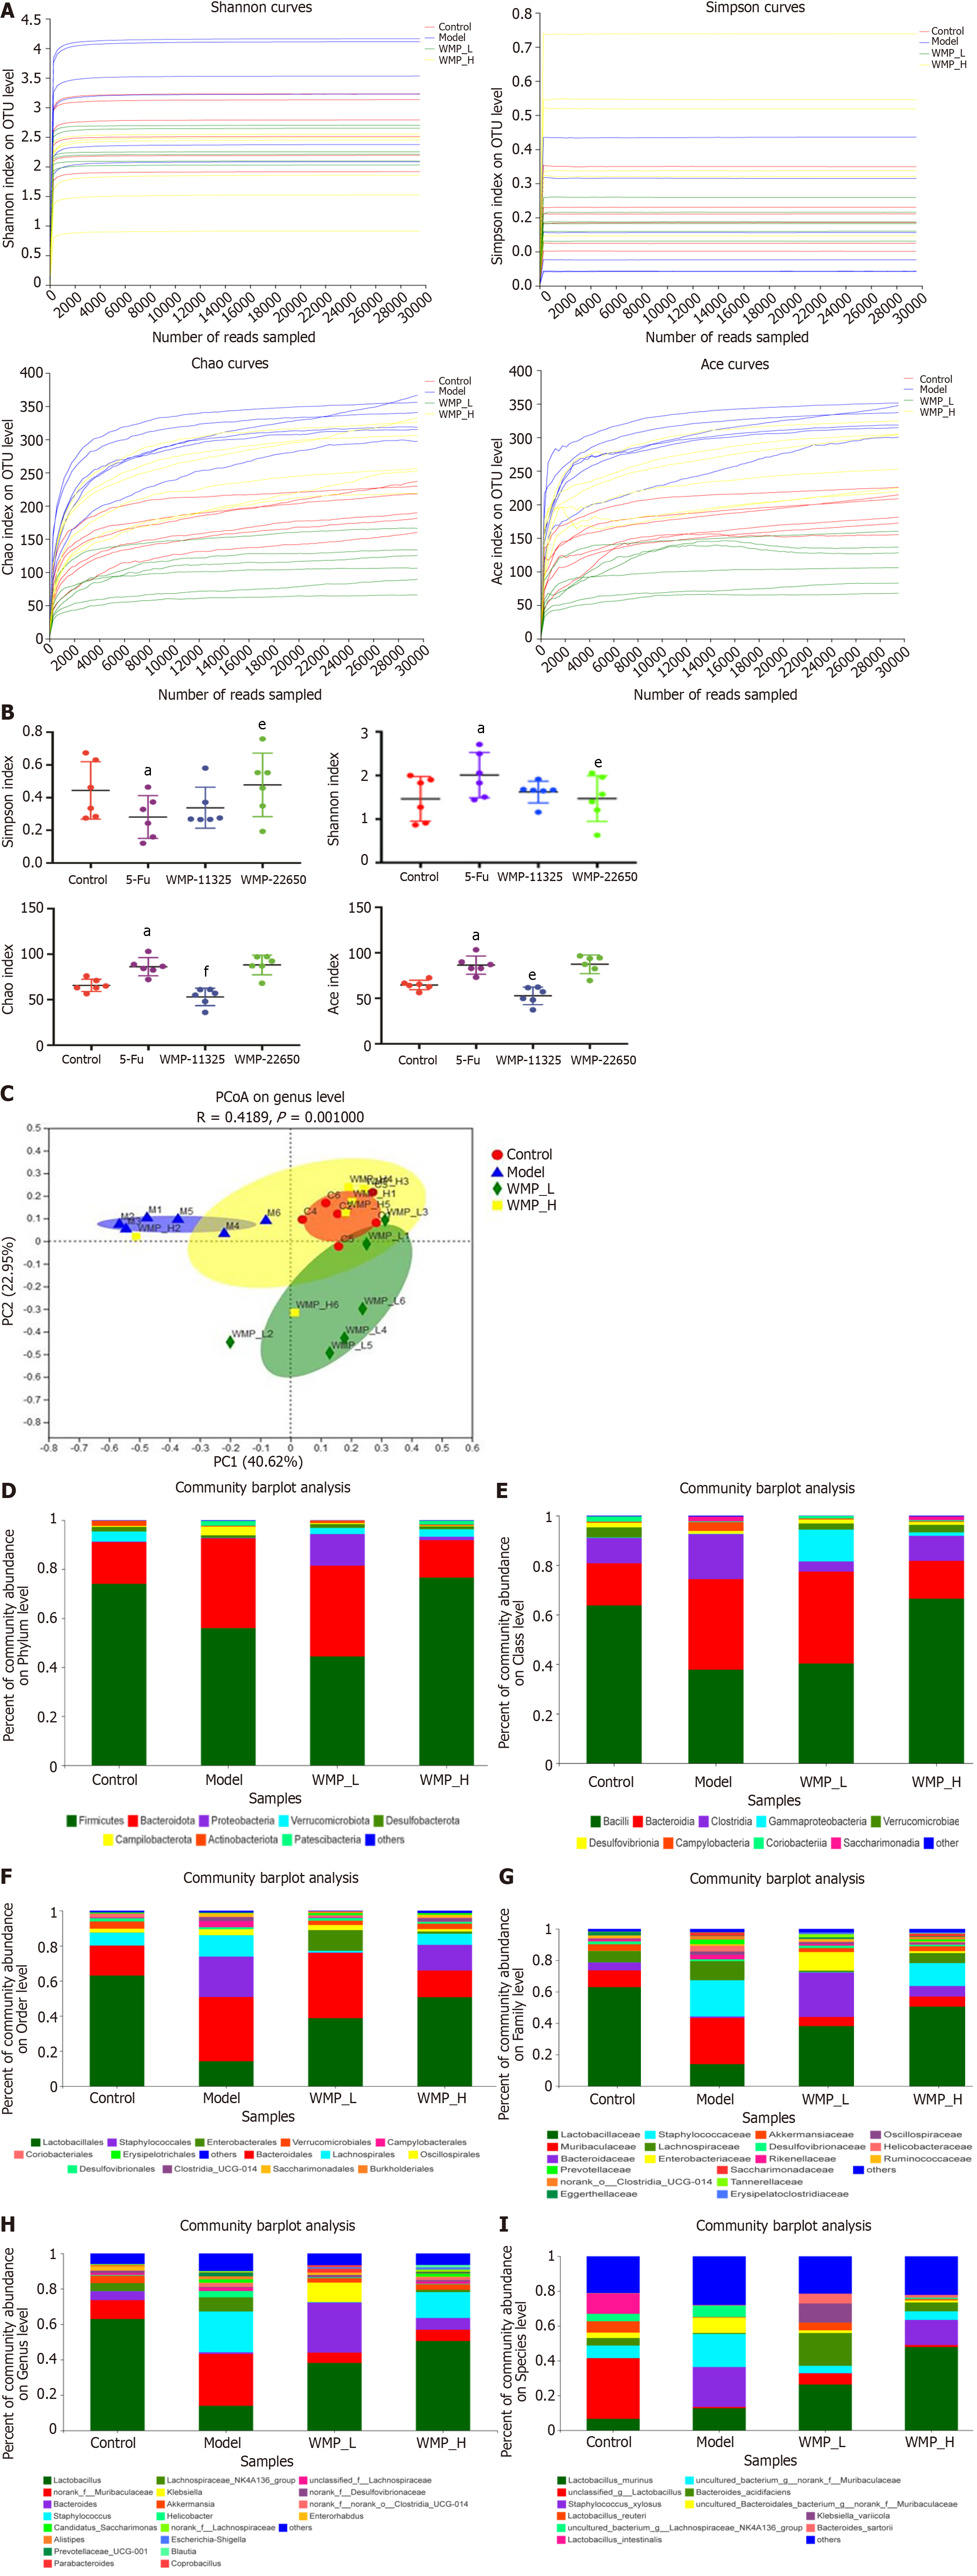
Figure 5 Microbial alpha, beta diversity, and taxonomy analysis.
A: Dilution curve analysis; B: Alpha diversity (Shannon index, Simpson index, Ace index, and Chao index); C: Beta diversity; D-I: Taxonomy analysis of microbiota community. Values represent the mean ± SEM. aP < 0.05 vs control group and eP < 0.05, fP < 0.01 vs 5-Fu group. WMP: Wumei pills; 5-Fu: 5-fluorouracil.
- Citation: Lu DX, Liu F, Wu H, Liu HX, Chen BY, Yan J, Lu Y, Sun ZG. Wumei pills attenuates 5-fluorouracil-induced intestinal mucositis through Toll-like receptor 4/myeloid differentiation factor 88/nuclear factor-κB pathway and microbiota regulation. World J Gastroenterol 2022; 28(32): 4574-4599
- URL: https://www.wjgnet.com/1007-9327/full/v28/i32/4574.htm
- DOI: https://dx.doi.org/10.3748/wjg.v28.i32.4574


