Copyright
©The Author(s) 2022.
World J Gastroenterol. Aug 21, 2022; 28(31): 4376-4389
Published online Aug 21, 2022. doi: 10.3748/wjg.v28.i31.4376
Published online Aug 21, 2022. doi: 10.3748/wjg.v28.i31.4376
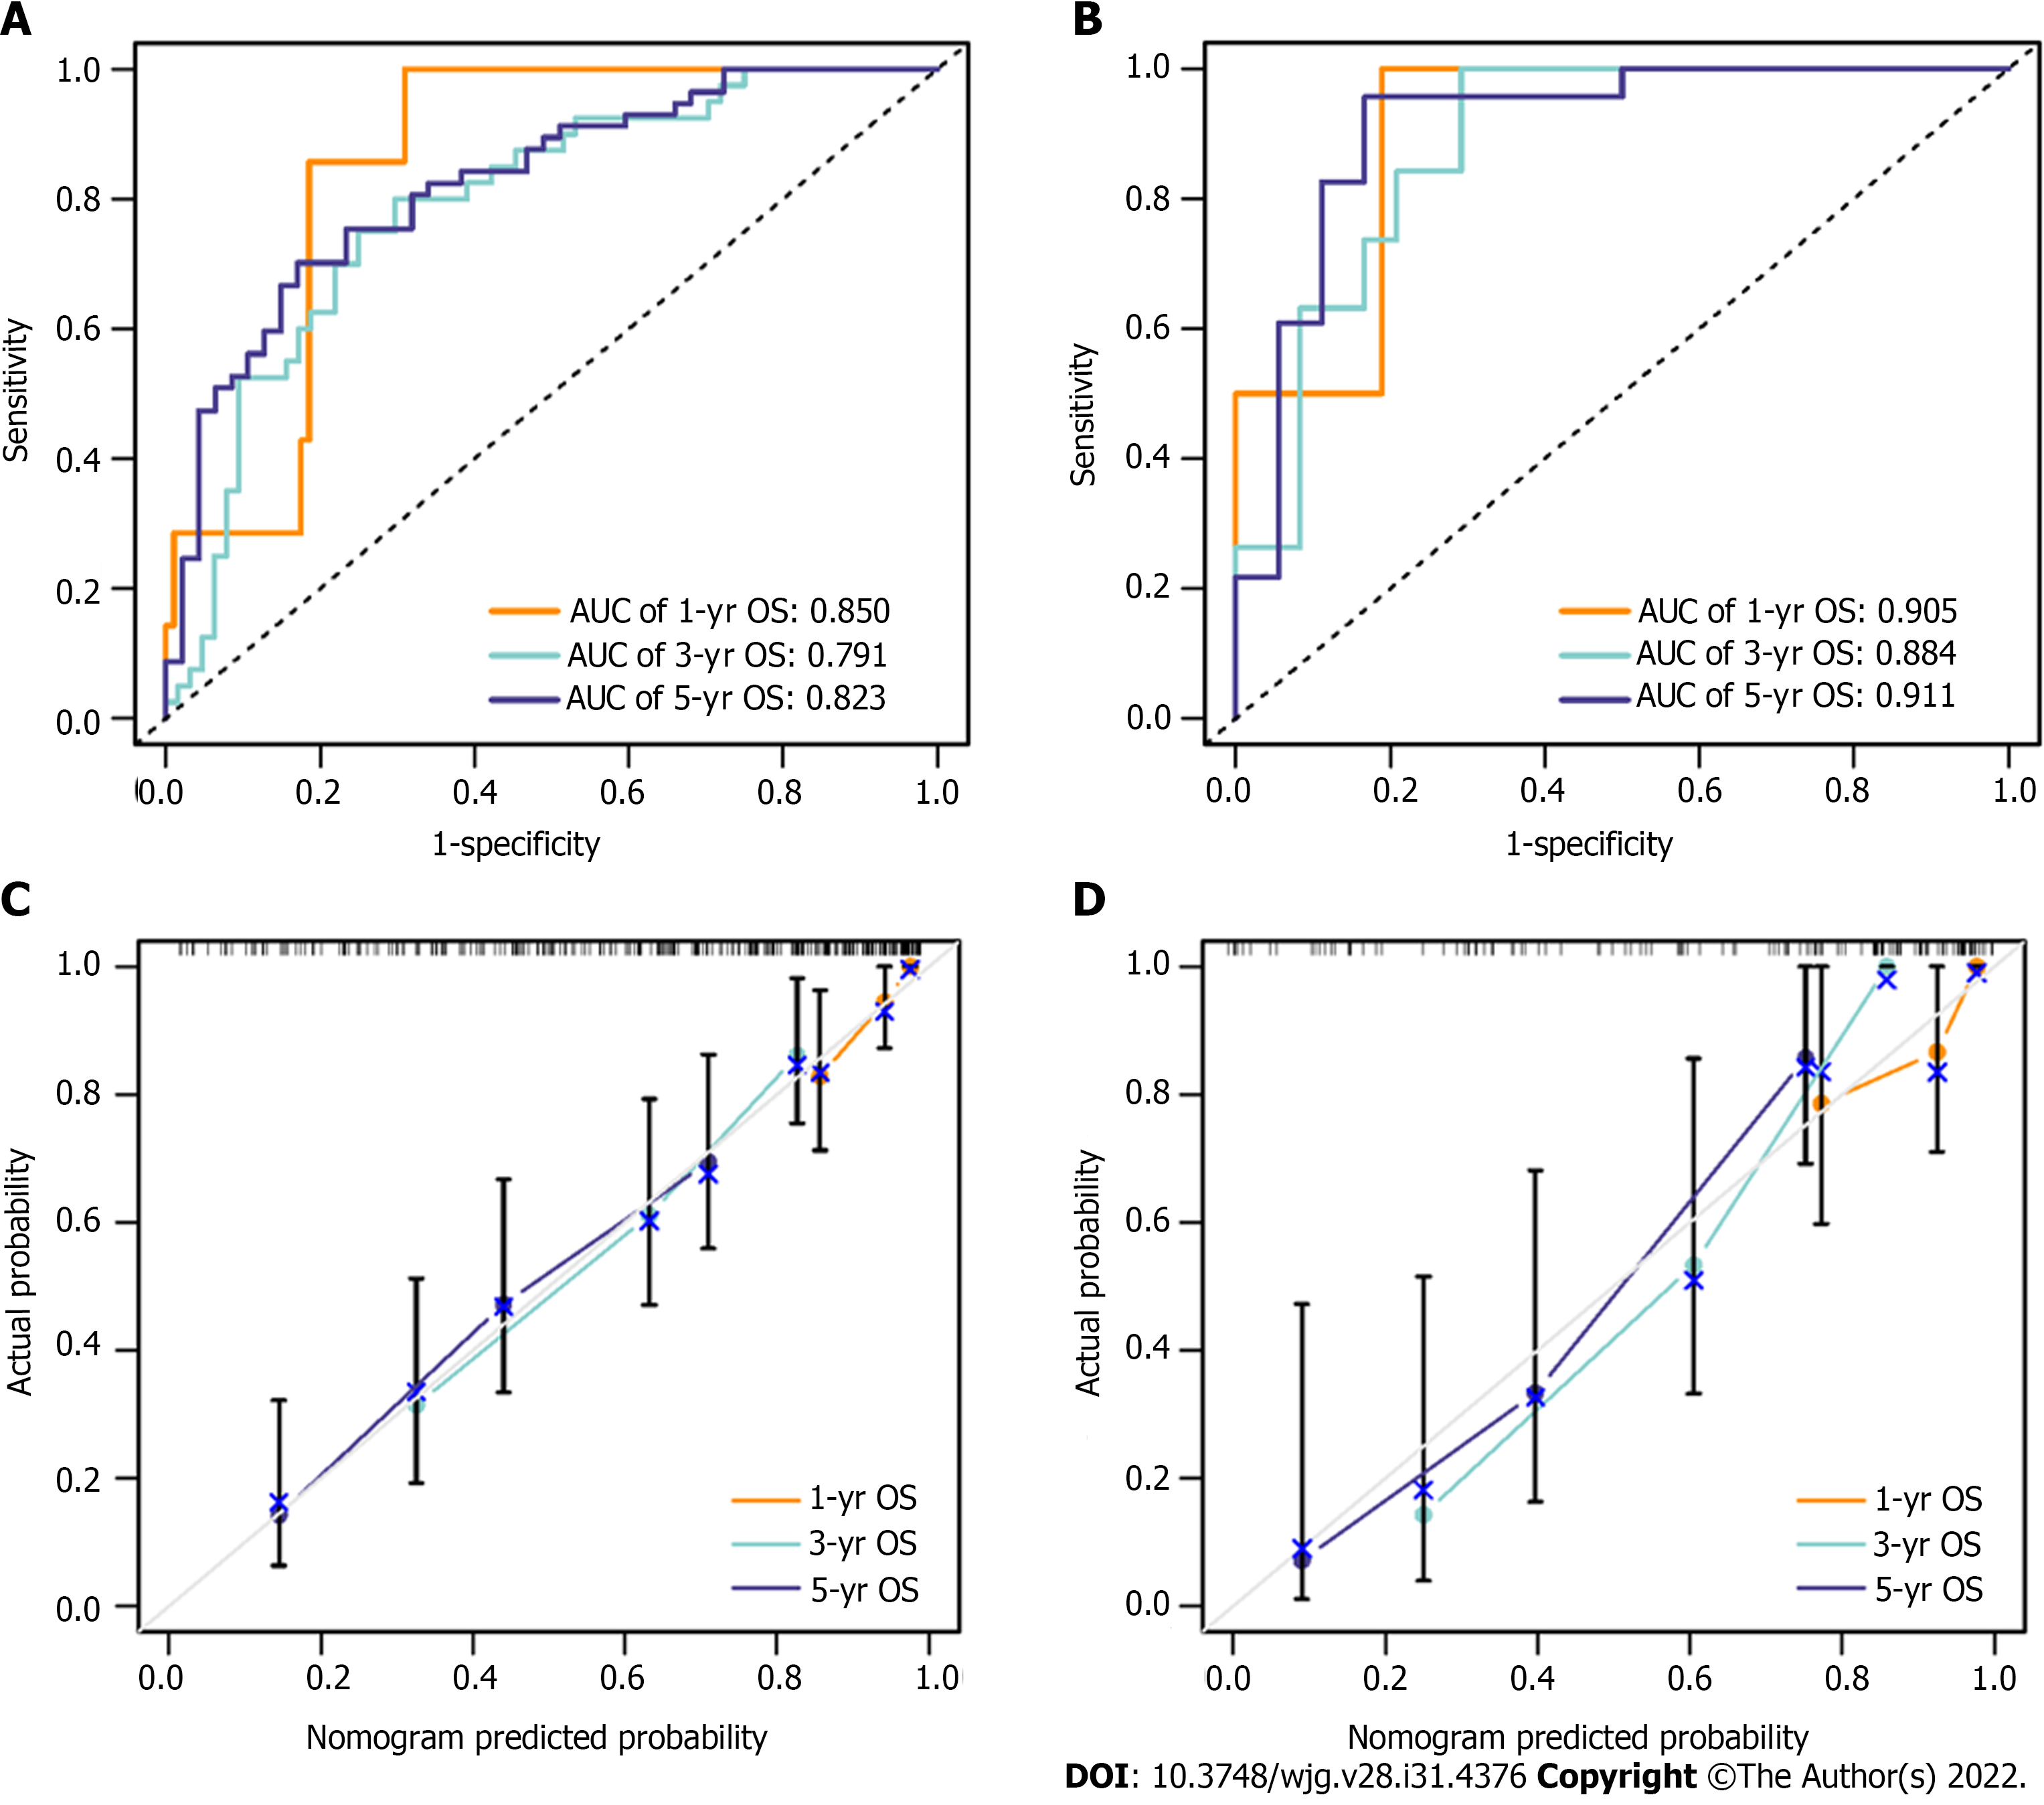
Figure 5 Accuracy of the nomogram for predicting 1-, 3- and 5-year OS in the training and validation cohorts was evaluated by receiver operating characteristic curves and calibration curves.
A and B: Receiver operating characteristic curves of the nomogram in the training cohort (A) and validation cohort (B); C and D: Calibration curves of the nomogram in the training cohort (C) and validation cohort (D). In the calibration curve, the nomogram-predicted survival probability is represented on the x-axis, and the actual outcome of overall survival is represented on the y-axis. A closer fit of the coloured lines to the ideal grey line indicates better accuracy in predicting OS. OS: Overall survival; AUC: Area under the curve.
- Citation: Deng PZ, Zhao BG, Huang XH, Xu TF, Chen ZJ, Wei QF, Liu XY, Guo YQ, Yuan SG, Liao WJ. Preoperative contrast-enhanced computed tomography-based radiomics model for overall survival prediction in hepatocellular carcinoma. World J Gastroenterol 2022; 28(31): 4376-4389
- URL: https://www.wjgnet.com/1007-9327/full/v28/i31/4376.htm
- DOI: https://dx.doi.org/10.3748/wjg.v28.i31.4376


