Copyright
©The Author(s) 2022.
World J Gastroenterol. Aug 21, 2022; 28(31): 4376-4389
Published online Aug 21, 2022. doi: 10.3748/wjg.v28.i31.4376
Published online Aug 21, 2022. doi: 10.3748/wjg.v28.i31.4376
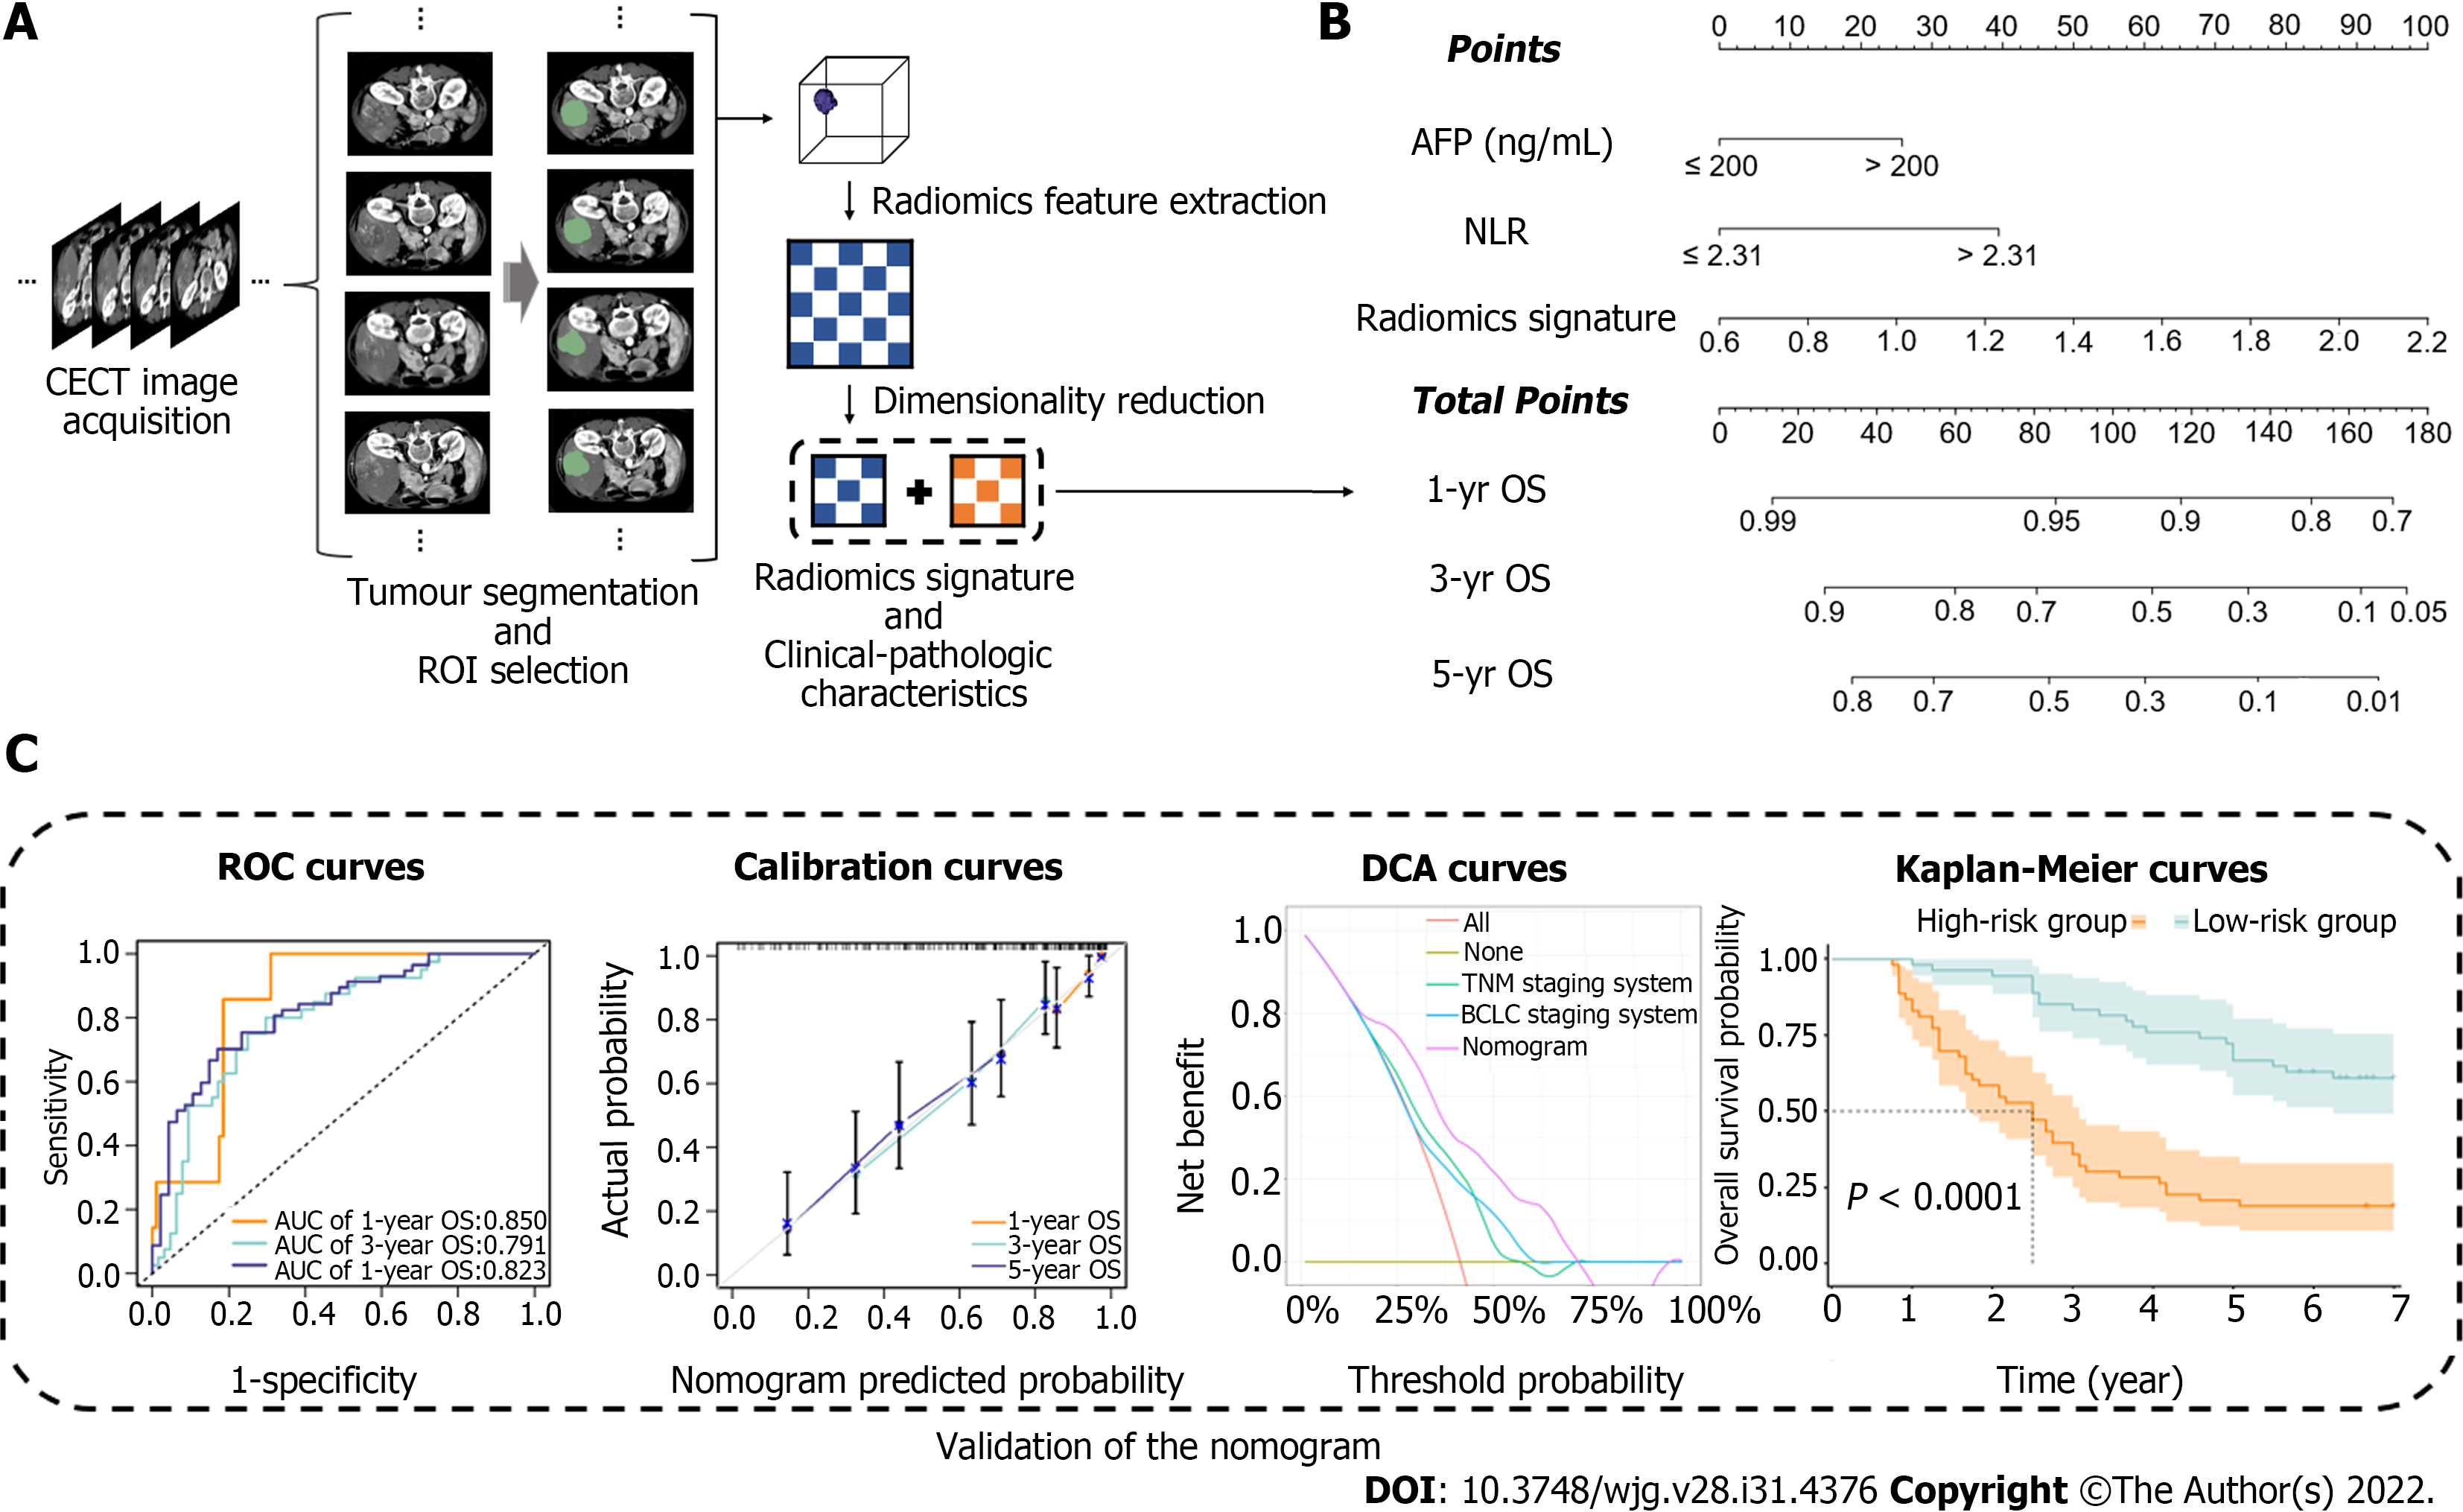
Figure 2 Workflow of model construction and validation.
A: Contrast-enhanced computed tomography image acquisition, tumour segmentation, region of interest selection, radiomics feature extraction and radiomics signature construction; B: Combination of the radiomics signature and clinical-pathologic characteristics to build the predictive model, the model was visualized via nomogram; C: Evaluation of the predictive model by using receiver operating characteristic curves, calibration curves, decision curve analysis curves and Kaplan–Meier curves. CECT: Contrast-enhanced computed tomography; ROI: Region of interest; AFP: Alpha fetoprotein; NLR: Neutrophil-to-lymphocyte ratio; OS: Overall survival; ROC: Receiver operating characteristic; AUC: Area under the curve; DCA: Decision curve analysis; BCLC: Barcelona Clinic Liver Cancer.
- Citation: Deng PZ, Zhao BG, Huang XH, Xu TF, Chen ZJ, Wei QF, Liu XY, Guo YQ, Yuan SG, Liao WJ. Preoperative contrast-enhanced computed tomography-based radiomics model for overall survival prediction in hepatocellular carcinoma. World J Gastroenterol 2022; 28(31): 4376-4389
- URL: https://www.wjgnet.com/1007-9327/full/v28/i31/4376.htm
- DOI: https://dx.doi.org/10.3748/wjg.v28.i31.4376


