Copyright
©The Author(s) 2022.
World J Gastroenterol. Aug 21, 2022; 28(31): 4363-4375
Published online Aug 21, 2022. doi: 10.3748/wjg.v28.i31.4363
Published online Aug 21, 2022. doi: 10.3748/wjg.v28.i31.4363
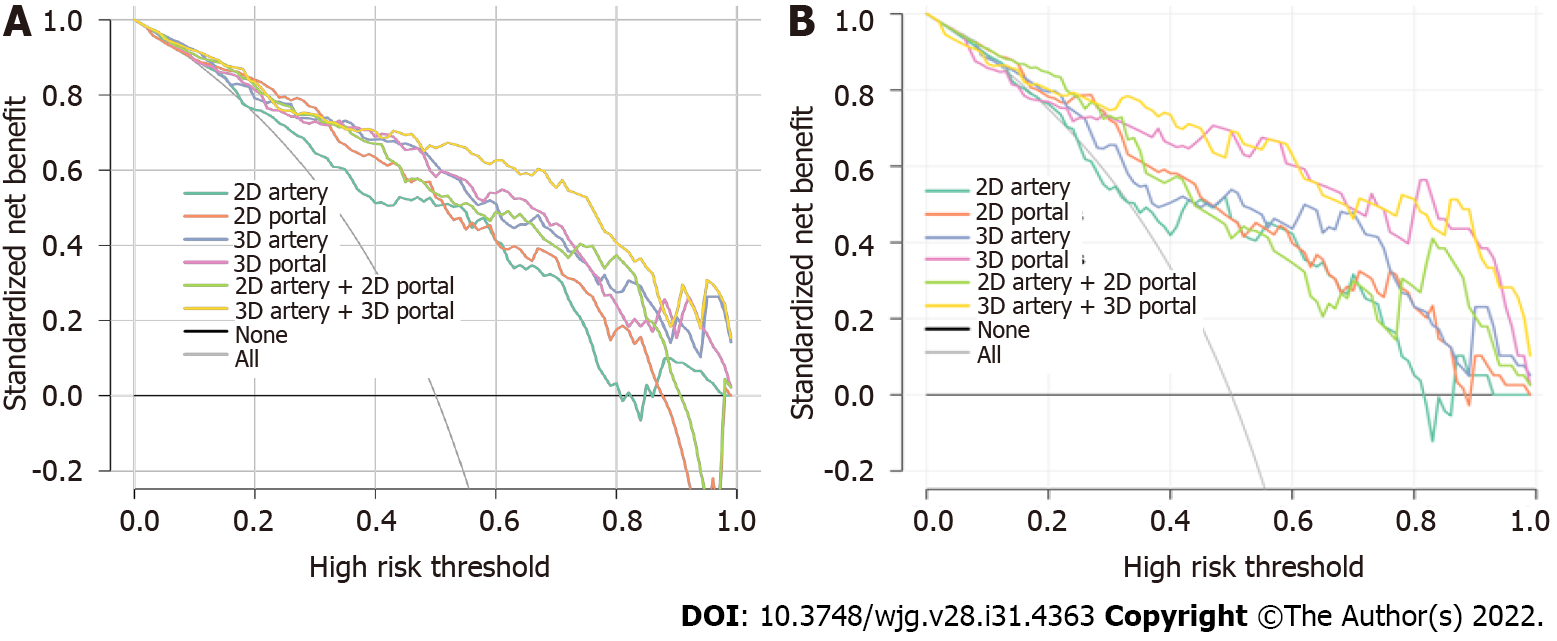
Figure 6 Decision curves for 2D-arterial model, 2D venous model, 3D-arterial model, 3D venous model, 2D arterial-venous combined model, and 3D arterial-venous combined model.
A: Training group; B: Test group. The black horizontal line indicates no lesions as squamous cell carcinoma (NONE) and the grey line indicates all lesions as squamous cell carcinoma (ALL). The colored lines of each model respectively illustrate the net benefit brought to each patient. The closer the decision curves to the black and gray curves, the similar the clinical decision net benefit of the model compared with “treat ALL” or “treat NONE” decision. When comparing different models, the higher the model curve within the same threshold probability, the higher the clinical net benefit resulting from the model.
- Citation: Du KP, Huang WP, Liu SY, Chen YJ, Li LM, Liu XN, Han YJ, Zhou Y, Liu CC, Gao JB. Application of computed tomography-based radiomics in differential diagnosis of adenocarcinoma and squamous cell carcinoma at the esophagogastric junction. World J Gastroenterol 2022; 28(31): 4363-4375
- URL: https://www.wjgnet.com/1007-9327/full/v28/i31/4363.htm
- DOI: https://dx.doi.org/10.3748/wjg.v28.i31.4363


