Copyright
©The Author(s) 2022.
World J Gastroenterol. Aug 21, 2022; 28(31): 4363-4375
Published online Aug 21, 2022. doi: 10.3748/wjg.v28.i31.4363
Published online Aug 21, 2022. doi: 10.3748/wjg.v28.i31.4363
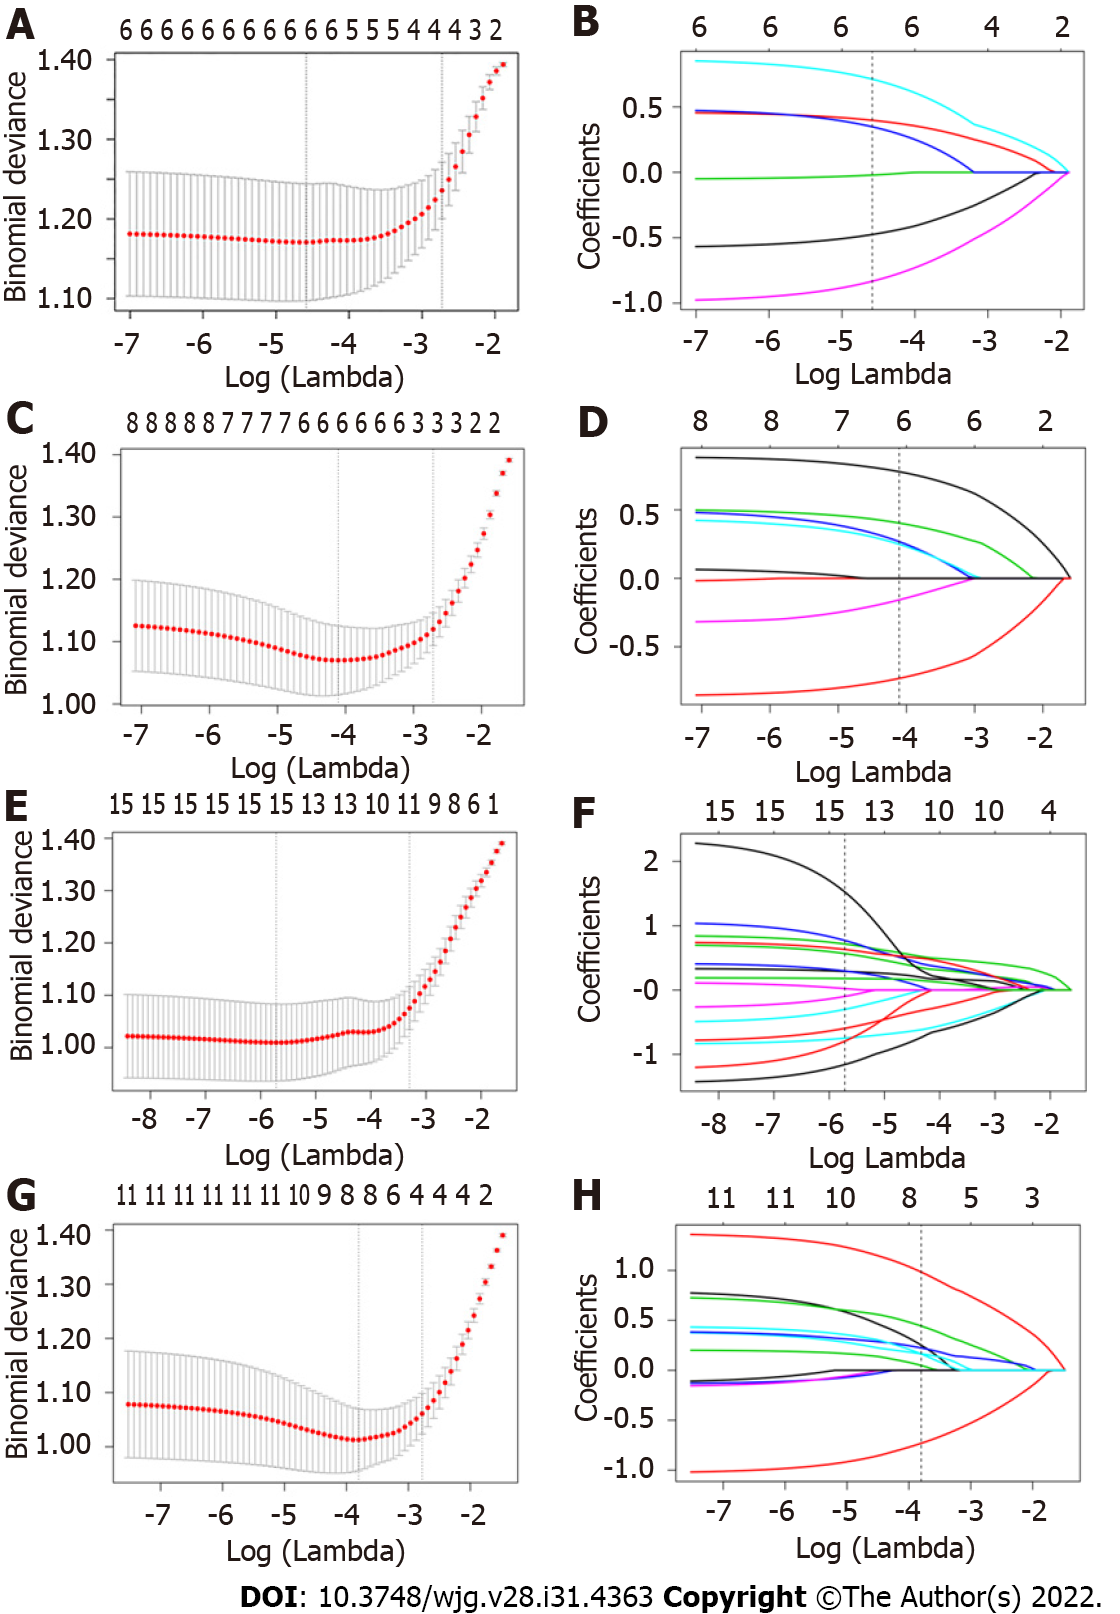
Figure 3 Least absolute shrinkage and selection operator logistic regression feature screening graphs.
The radiomics feature screening using the least absolute shrinkage and selection operator regression was performed to select the optimal model parameter λ using 10-fold cross-validation. A, C, E, and G: Graphs of binomial deviation of 2D-arterial model, 2D-venous model, 3D-arterial model, and 3D-venous model with parameter λ, respectively. The dashed lines indicate the selected optimal log(λ) values and the location of one standard error; B, D, F, and H: Graphs of variation of the radiomics characteristic coefficients with log(λ) for 2D-arterial model, 2D-venous model, 3D-arterial model, and 3D-venous model, respectively. The dotted line indicates the location of the selected optimal log(λ) value.
- Citation: Du KP, Huang WP, Liu SY, Chen YJ, Li LM, Liu XN, Han YJ, Zhou Y, Liu CC, Gao JB. Application of computed tomography-based radiomics in differential diagnosis of adenocarcinoma and squamous cell carcinoma at the esophagogastric junction. World J Gastroenterol 2022; 28(31): 4363-4375
- URL: https://www.wjgnet.com/1007-9327/full/v28/i31/4363.htm
- DOI: https://dx.doi.org/10.3748/wjg.v28.i31.4363


