Copyright
©The Author(s) 2022.
World J Gastroenterol. Aug 21, 2022; 28(31): 4338-4350
Published online Aug 21, 2022. doi: 10.3748/wjg.v28.i31.4338
Published online Aug 21, 2022. doi: 10.3748/wjg.v28.i31.4338
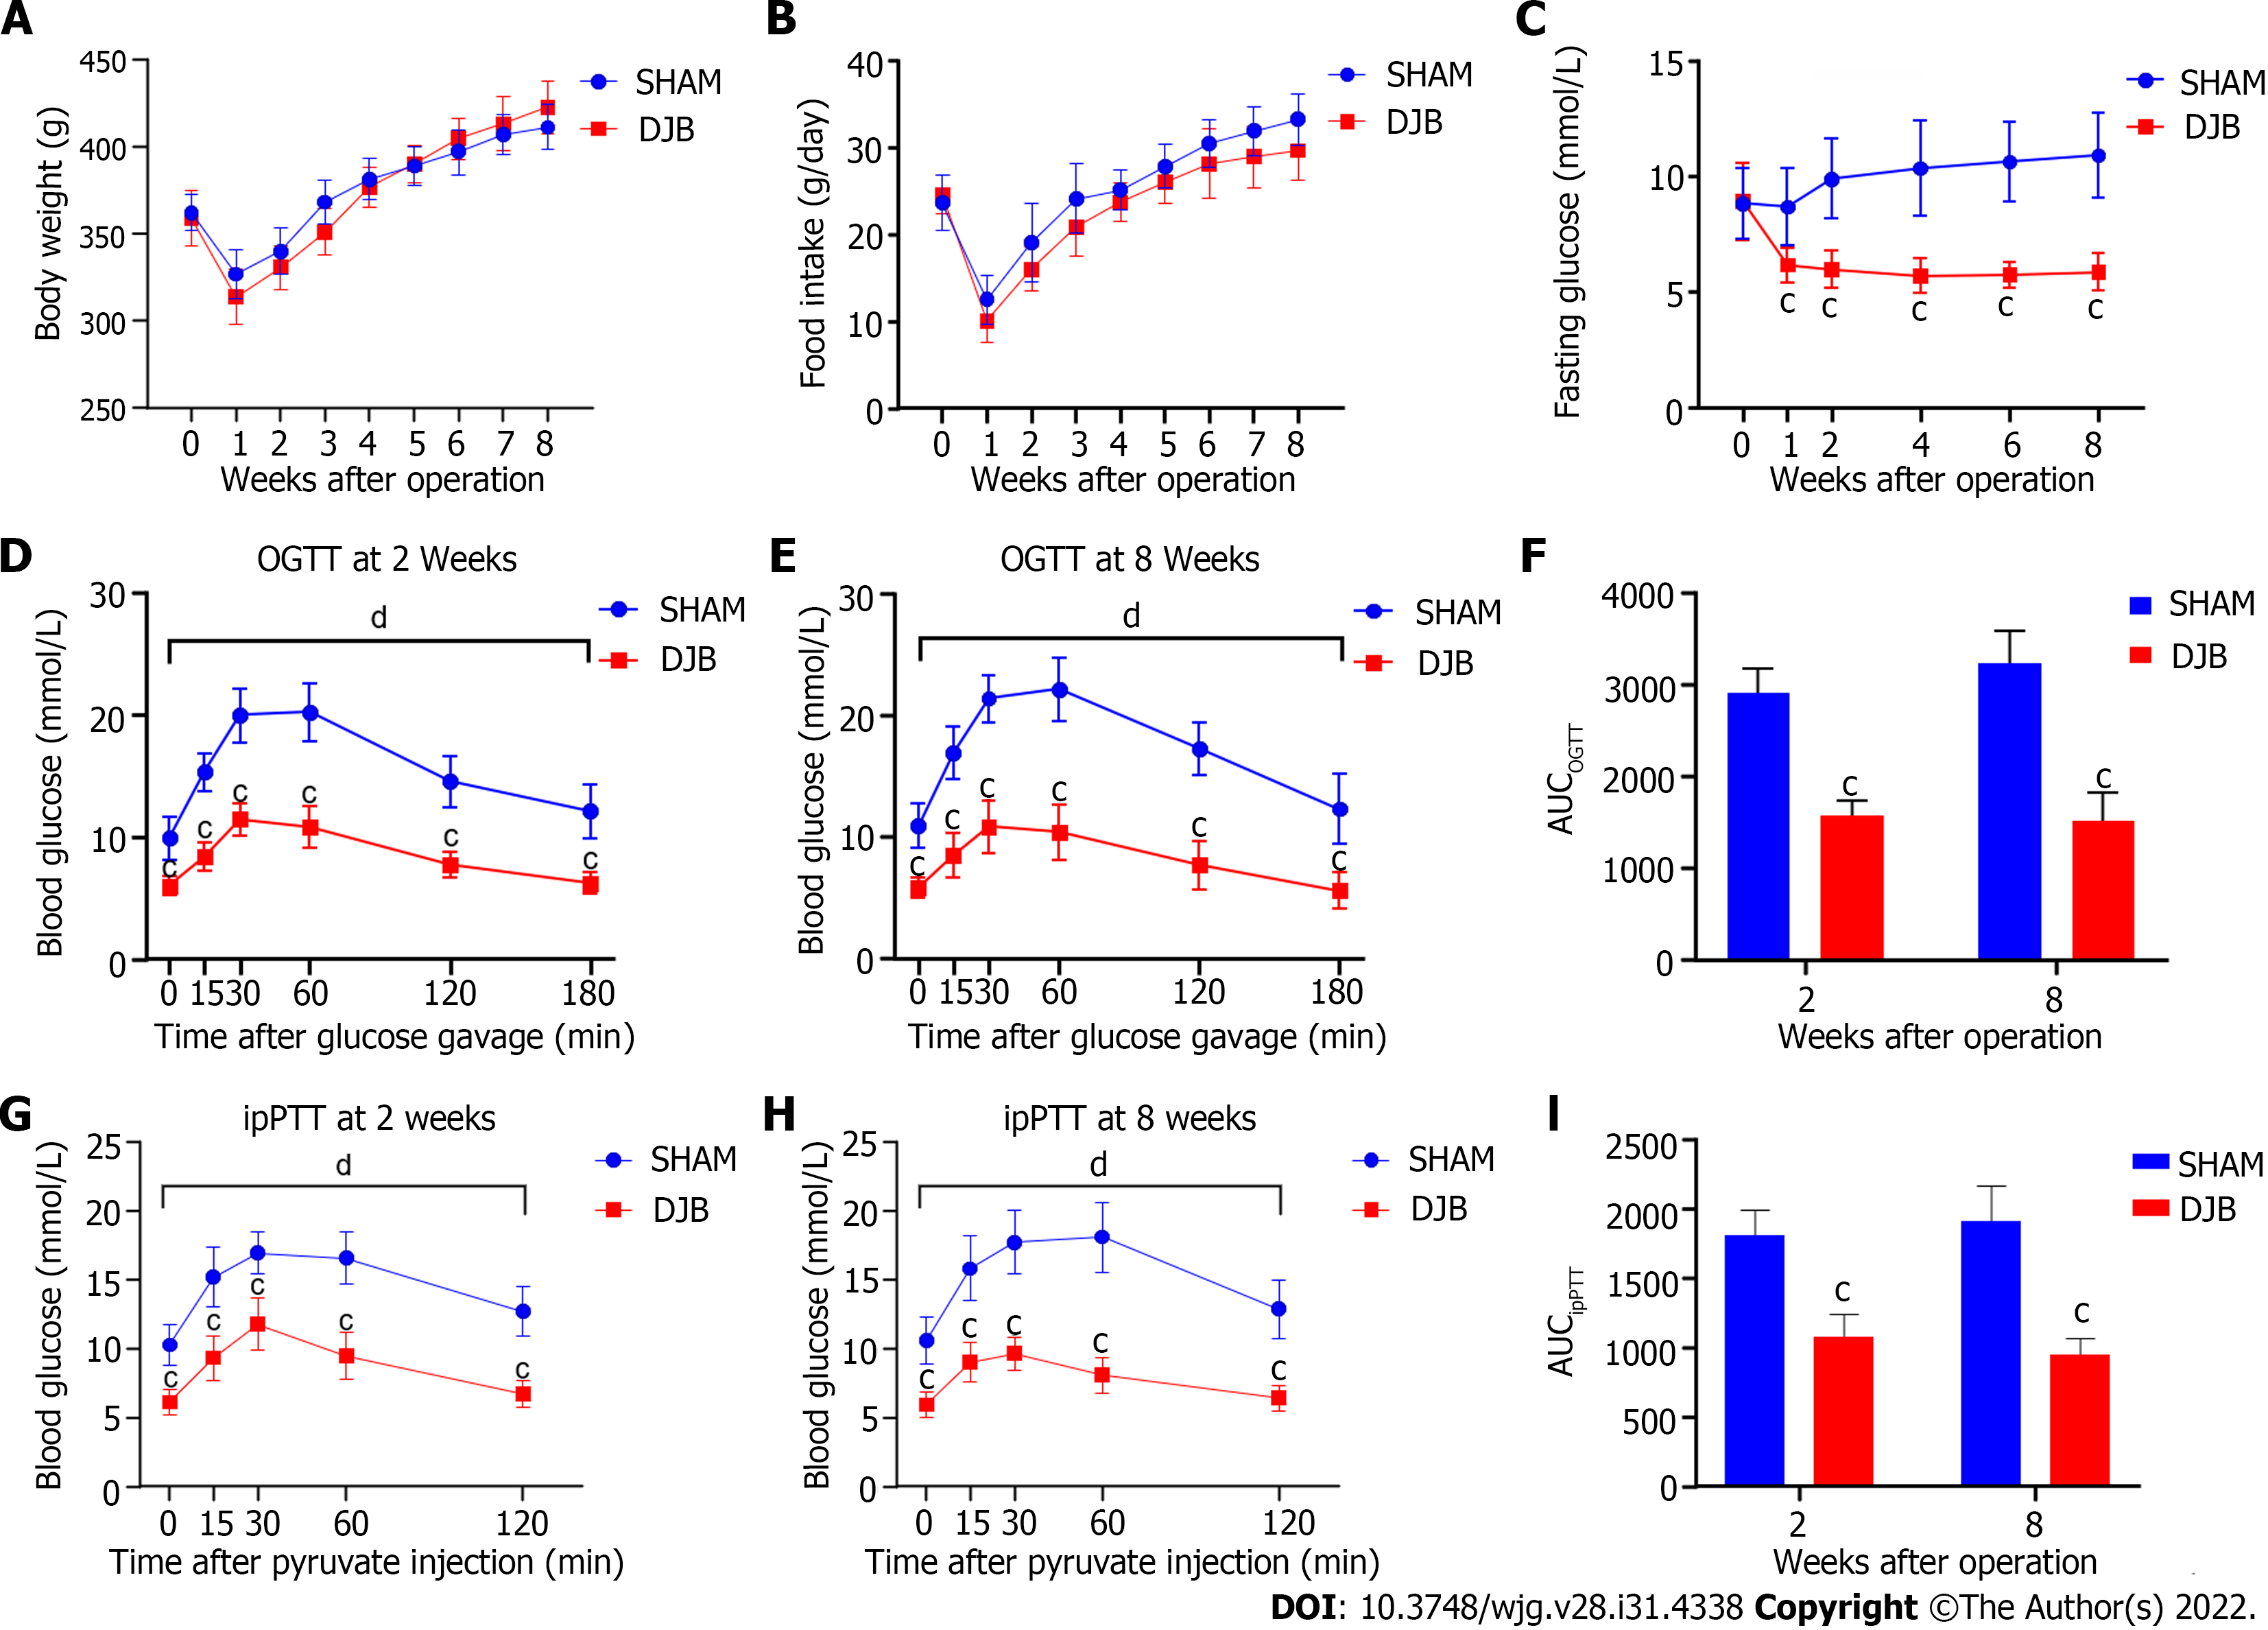
Figure 1 Effects of duodenal-jejunal bypass on metabolic parameters.
A: Body weight of rats; B: Food intake of rats; C: Fasting blood glucose of rats; D: Oral glucose tolerance test (OGTT) at 2 wk after operation; E: OGTT at 8 wk after operation; F: Area under the curve (AUC) of OGTT at 2 and 8 wk after operation; G: Intraperitoneal pyruvate tolerance test (ipPTT) at 2 wk after operation; H: ipPTT at 8 wk after operation; I: AUCipPTT at 2 and 8 wk after operation. cP < 0.001 duodenal-jejunal bypass (DJB) vs sham group by the Student’s t-test or post-hoc Bonferroni’s multiple comparison test. dP < 0.001, DJB vs sham group by mixed model ANOVA. AUCOGTT: Area under the curve of oral glucose tolerance test; AUCipPTT: Area under the curve of intraperitoneal pyruvate tolerance test; OGTT: Oral glucose tolerance test; ipPTT: Intraperitoneal pyruvate tolerance test; DJB: Duodenal-jejunal bypass.
- Citation: Han HF, Liu SZ, Zhang X, Wei M, Huang X, Yu WB. Duodenal-jejunal bypass increases intraduodenal bile acids and upregulates duodenal SIRT1 expression in high-fat diet and streptozotocin-induced diabetic rats. World J Gastroenterol 2022; 28(31): 4338-4350
- URL: https://www.wjgnet.com/1007-9327/full/v28/i31/4338.htm
- DOI: https://dx.doi.org/10.3748/wjg.v28.i31.4338


