Copyright
©The Author(s) 2022.
World J Gastroenterol. Aug 14, 2022; 28(30): 4163-4173
Published online Aug 14, 2022. doi: 10.3748/wjg.v28.i30.4163
Published online Aug 14, 2022. doi: 10.3748/wjg.v28.i30.4163
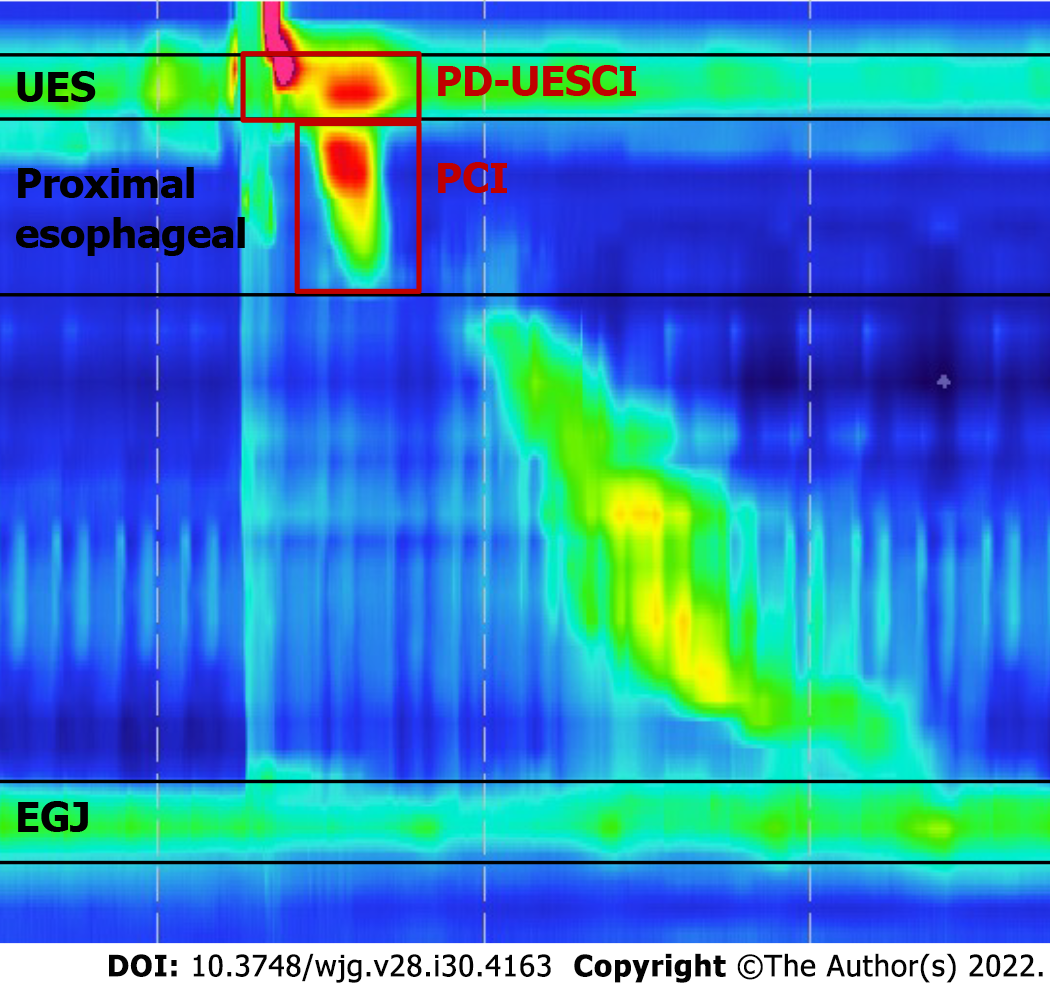
Figure 1 Key metrics of Clouse plots used in our study.
The postdeglutitive upper esophageal sphincter (UES) contractile integral was measured using a 20-mmHg pressure threshold from the beginning of the deglutitive UES relaxation to the end of the proximal esophageal contraction or the beginning of the transition zone. The proximal esophageal contractile integral was measured using a 20-mmHg pressure threshold from the lower border of the UES to either a break between the proximal and distal segment or the area with the lowest pressure between the proximal and distal segment of the contraction in patients showed no break in the 20-mmHg isobaric contour. UES: Upper esophageal sphincter; PD-UESCI: Postdeglutitive upper esophageal sphincter contractile integral; PCI: Proximal contractile integral; EGJ: Esophagogastric junction.
- Citation: Li YY, Lu WT, Liu JX, Wu LH, Chen M, Jiao HM. Changes in the esophagogastric junction outflow obstruction manometric feature based on the Chicago Classification updates. World J Gastroenterol 2022; 28(30): 4163-4173
- URL: https://www.wjgnet.com/1007-9327/full/v28/i30/4163.htm
- DOI: https://dx.doi.org/10.3748/wjg.v28.i30.4163


