Copyright
©The Author(s) 2022.
World J Gastroenterol. Aug 7, 2022; 28(29): 3981-3993
Published online Aug 7, 2022. doi: 10.3748/wjg.v28.i29.3981
Published online Aug 7, 2022. doi: 10.3748/wjg.v28.i29.3981
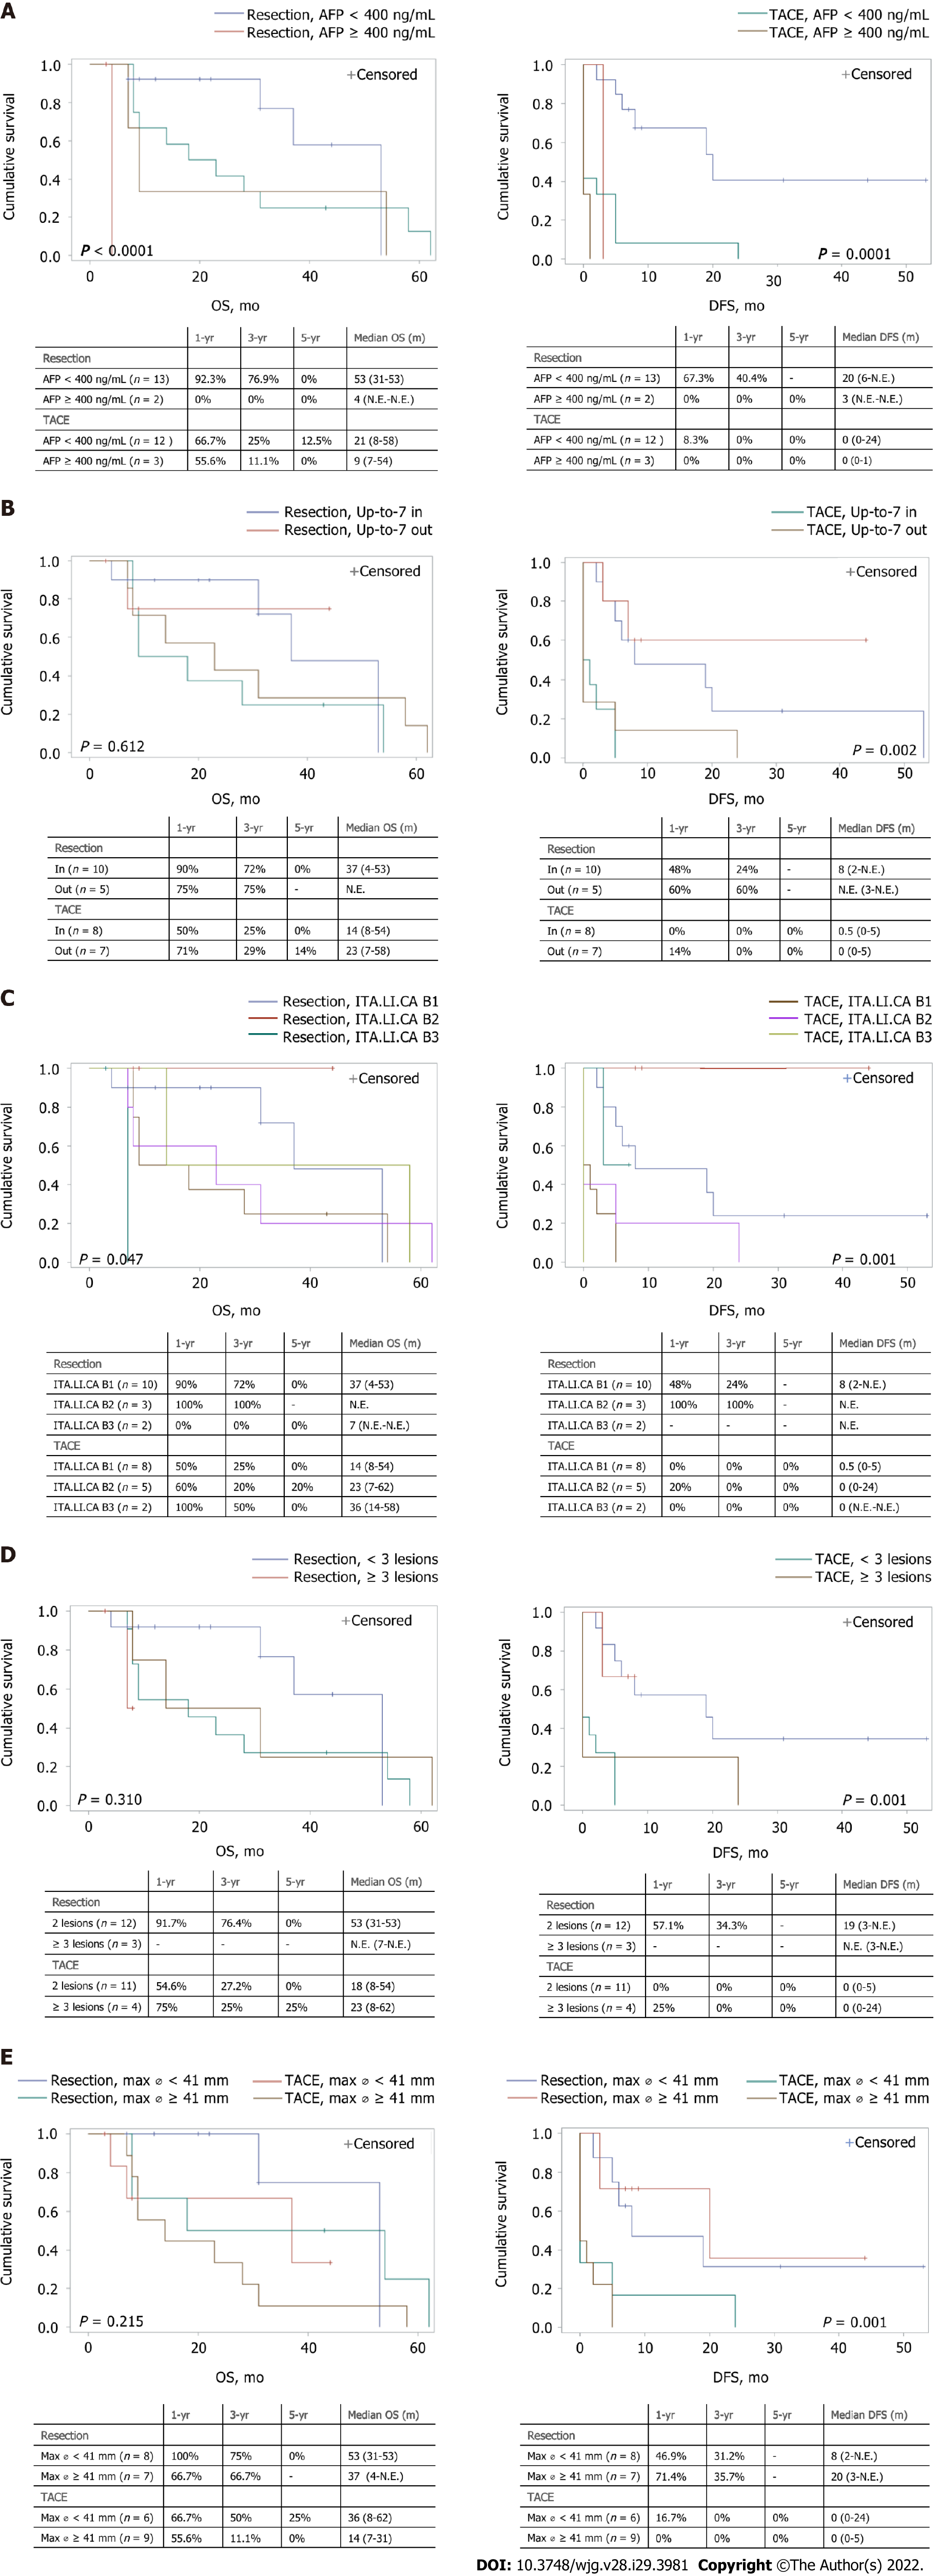
Figure 3 Kaplan–Meier curves of overall and disease-free survival comparing the results of the different treatment modalities for patients stratified by different parameters (n = 30).
A: Stratification by alpha-fetoprotein levels, lower or higher than 400 ng/mL [overall survival (OS): P < 0.0001 and disease-free survival (DFS): P = 0.0001]; B: Stratification by the Up-to-7 criteria, in or out (OS: P = 0.612 and DFS: P =0.002); C: Stratification by the ITA.LI.CA classification (OS: P = 0.047 and DFS: P = 0.001); D: Stratification by the number of lesions, 2 lesions or more than 3 lesions (OS: P = 0.310 and DFS: P = 0.001); E: Stratification by the maximum diameter of the lesion, smaller or bigger than 41 mm (OS: P = 0.215 and DFS: P = 0.001). Median survival is expressed as months and 95% confidence interval. OS: Overall survival; DFS: Disease-free survival; AFP: Alpha-fetoprotein; N.E.: Not Evaluable; TACE: Trans-Arterial ChemoEmbolization.
- Citation: Risaliti M, Bartolini I, Campani C, Arena U, Xodo C, Adotti V, Rosi M, Taddei A, Muiesan P, Amedei A, Batignani G, Marra F. Evaluating the best treatment for multifocal hepatocellular carcinoma: A propensity score-matched analysis. World J Gastroenterol 2022; 28(29): 3981-3993
- URL: https://www.wjgnet.com/1007-9327/full/v28/i29/3981.htm
- DOI: https://dx.doi.org/10.3748/wjg.v28.i29.3981


