Copyright
©The Author(s) 2022.
World J Gastroenterol. Aug 7, 2022; 28(29): 3960-3970
Published online Aug 7, 2022. doi: 10.3748/wjg.v28.i29.3960
Published online Aug 7, 2022. doi: 10.3748/wjg.v28.i29.3960
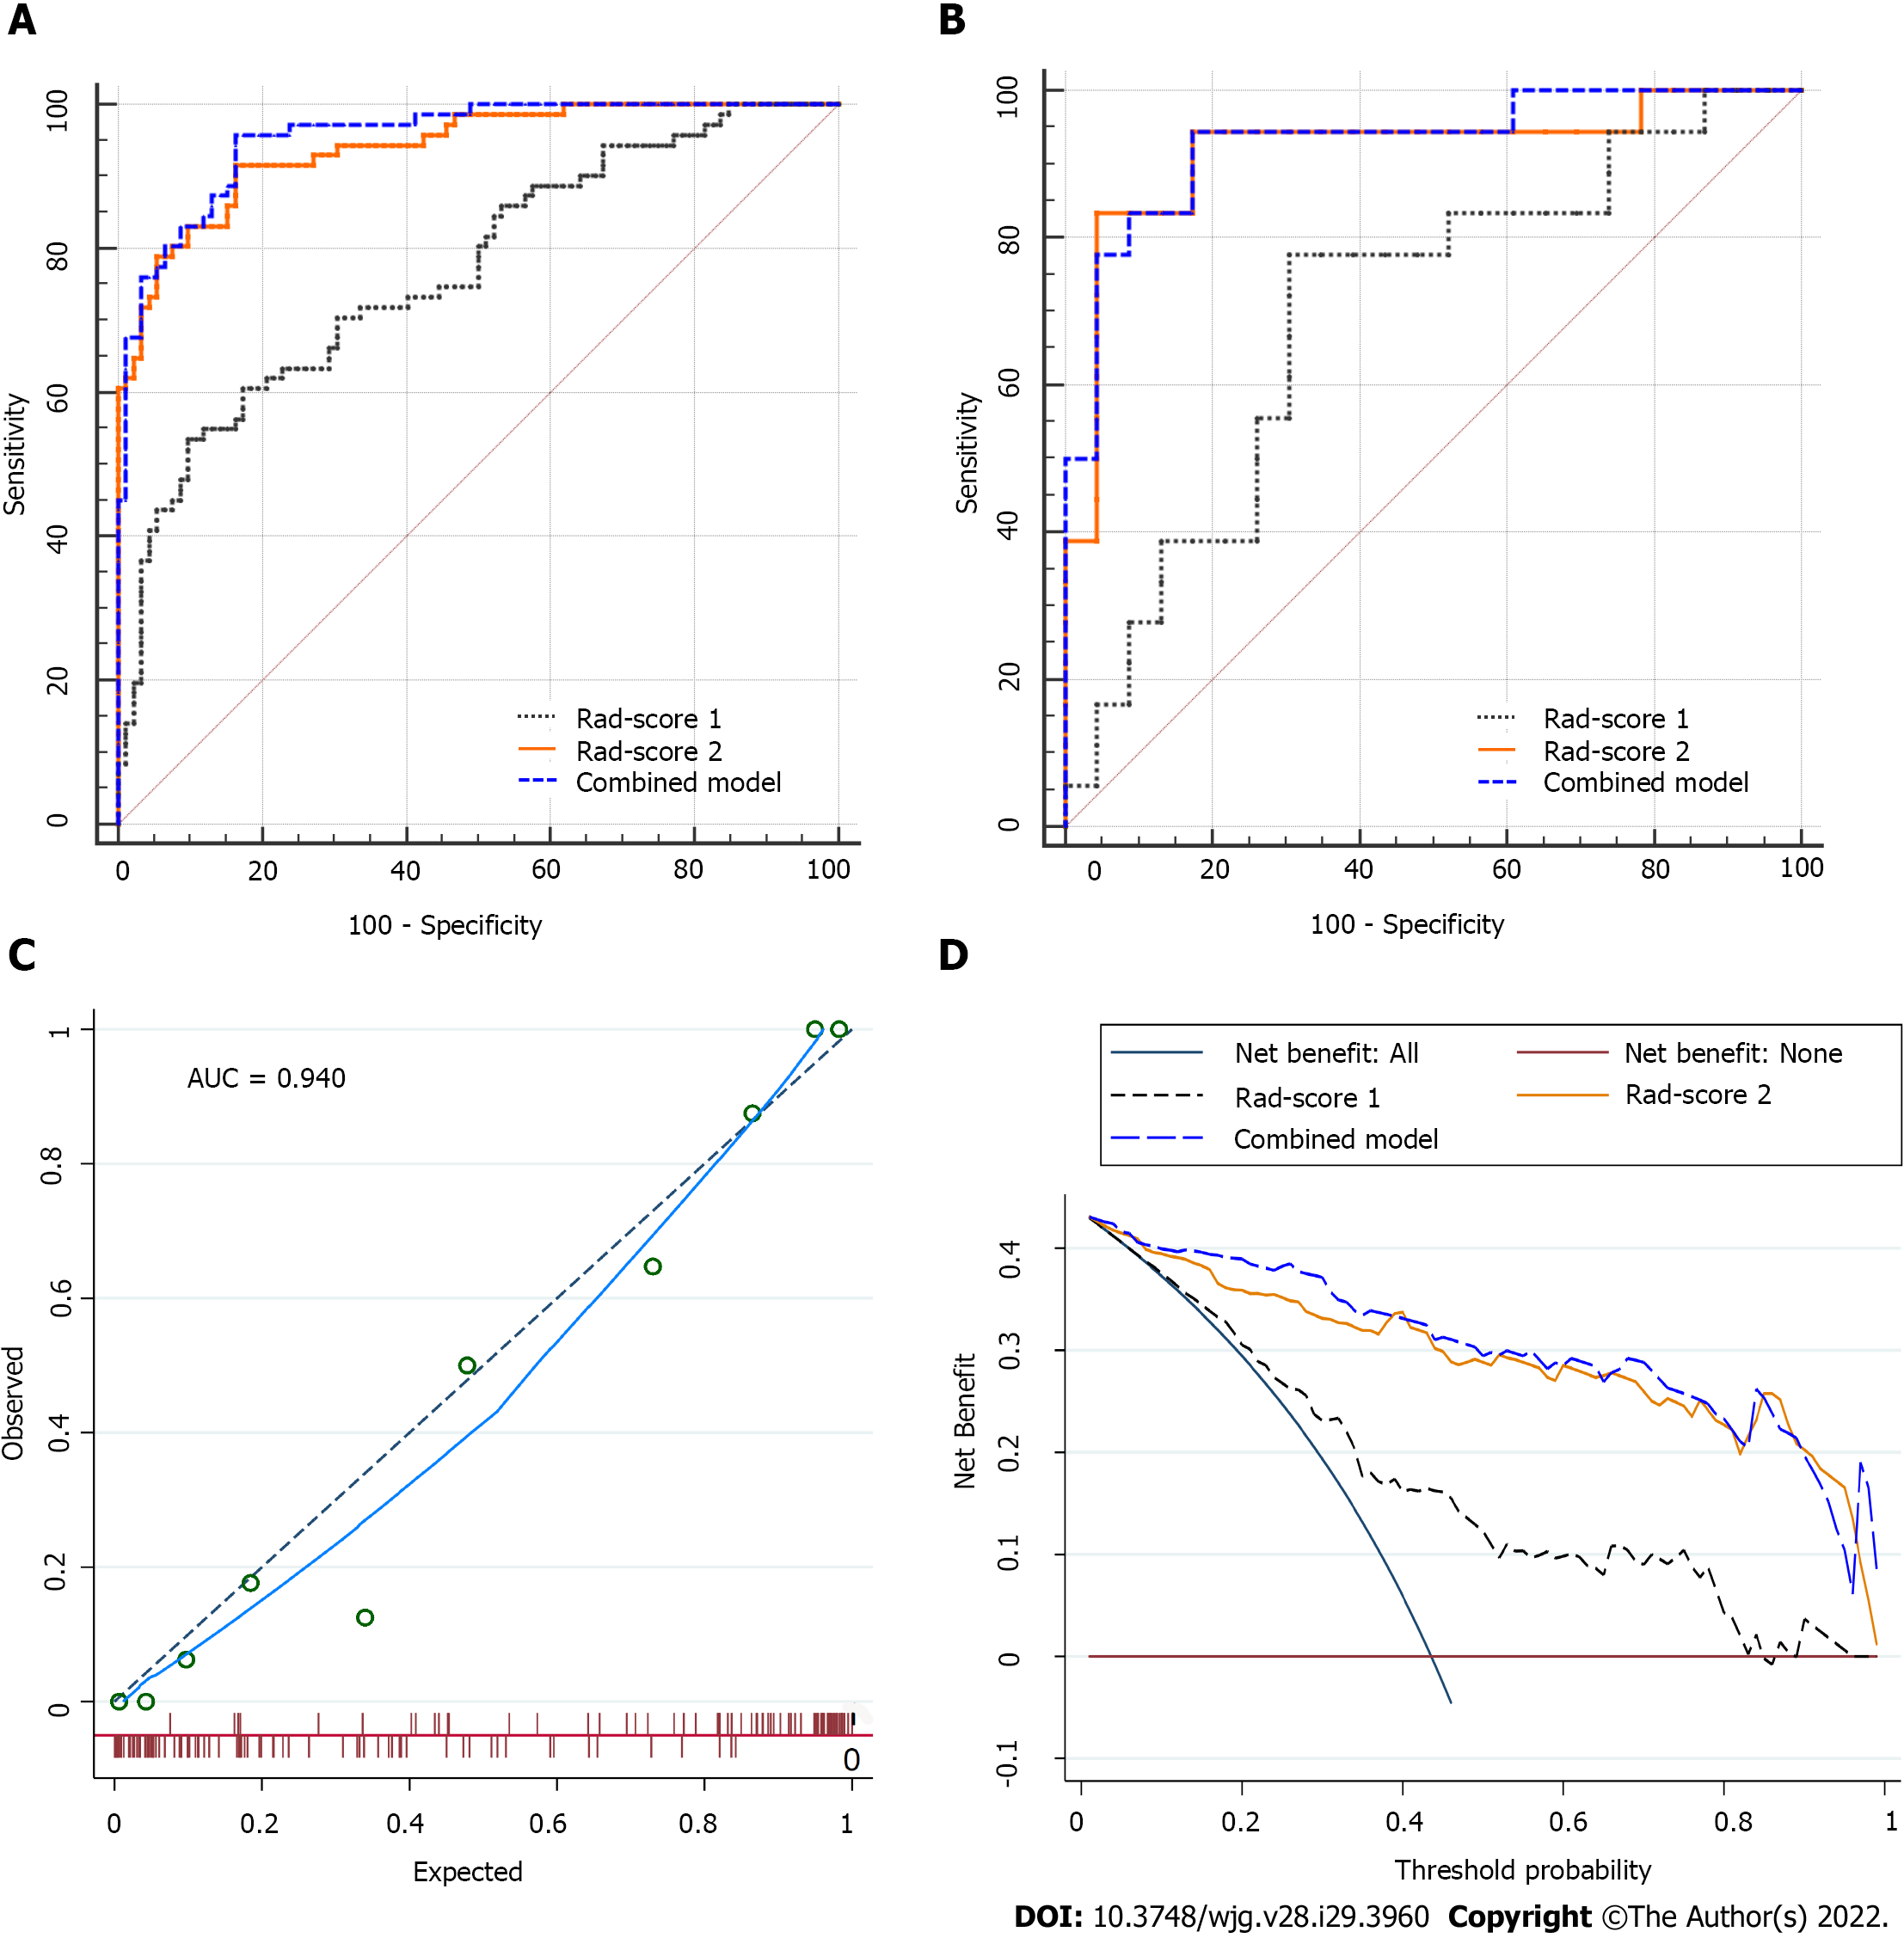
Figure 3 Comparisons of the receiver operating characteristic curves, and fit and usefulness evaluation of Rad-score 2.
A: In the training set: Area under the curve (AUC) = 0.768 for Rad-score 1, 0.955 for the combined model, and 0.940 for Rad-score 2; B: In the validation set: AUC = 0.700 for Rad-score 1, 0.930 for the combined model, and 0.918 for Rad-score 2; C: The calibration curve of Rad-score 2 shows good agreement between the predicted and observed risks in the training cohort; D: The decision curve demonstrates that Rad-score 2 obtains more benefit than “treat all”, “treat none”, and Rad-score 1. Rad-score 1: Rad-score of the main tumor; Rad-score 2: Rad-score of the largest peritumoral nodule; AUC: Area under the curve.
- Citation: Zhang YC, Li M, Jin YM, Xu JX, Huang CC, Song B. Radiomics for differentiating tumor deposits from lymph node metastasis in rectal cancer. World J Gastroenterol 2022; 28(29): 3960-3970
- URL: https://www.wjgnet.com/1007-9327/full/v28/i29/3960.htm
- DOI: https://dx.doi.org/10.3748/wjg.v28.i29.3960


