Copyright
©The Author(s) 2022.
World J Gastroenterol. Aug 7, 2022; 28(29): 3869-3885
Published online Aug 7, 2022. doi: 10.3748/wjg.v28.i29.3869
Published online Aug 7, 2022. doi: 10.3748/wjg.v28.i29.3869
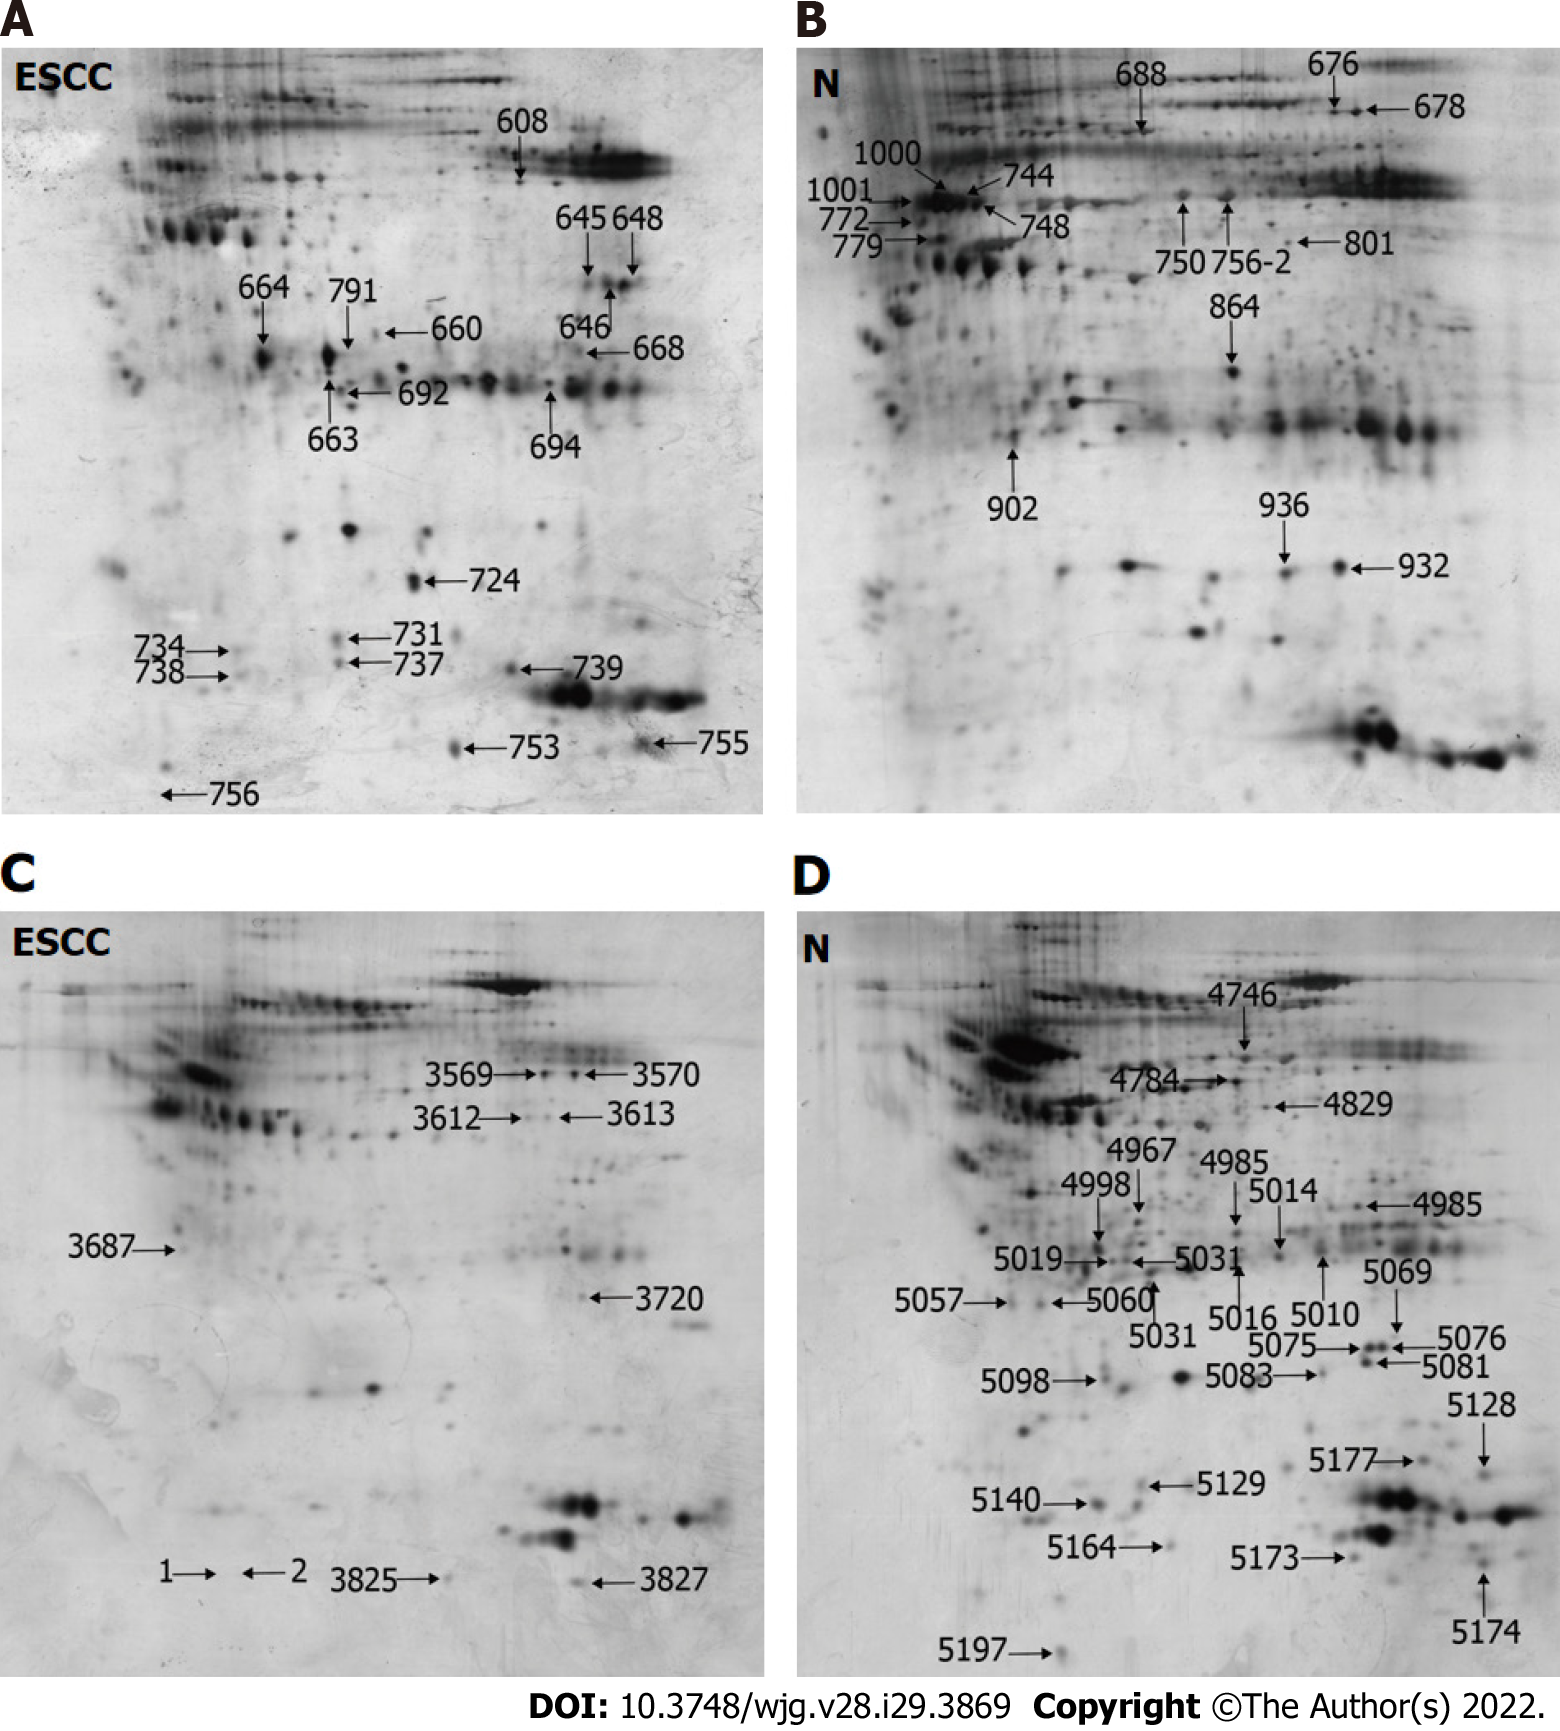
Figure 1 Representative two-dimensional gel electrophoresis images of N-linked glycoproteins from esophageal squamous cell carcinoma (ESCC) and adjacent non-cancerous tissues (N), in which the denoted numbers represent protein spots with differential expression.
A and B: Representative two-dimensional gel electrophoresis (2-DE) images of high-mannose glycoproteins from ESCC (A) and N (B); C and D: Representative 2-DE images of GlcNAc/sialic acid-containing glycoproteins from ESCC (C) and N (D). ESCC: Esophageal squamous cell carcinoma; N: Non-cancerous tissues.
- Citation: Liu QW, Ruan HJ, Chao WX, Li MX, Jiao YL, Ward DG, Gao SG, Qi YJ. N-linked glycoproteomic profiling in esophageal squamous cell carcinoma. World J Gastroenterol 2022; 28(29): 3869-3885
- URL: https://www.wjgnet.com/1007-9327/full/v28/i29/3869.htm
- DOI: https://dx.doi.org/10.3748/wjg.v28.i29.3869


