Copyright
©The Author(s) 2022.
World J Gastroenterol. Aug 7, 2022; 28(29): 3854-3868
Published online Aug 7, 2022. doi: 10.3748/wjg.v28.i29.3854
Published online Aug 7, 2022. doi: 10.3748/wjg.v28.i29.3854
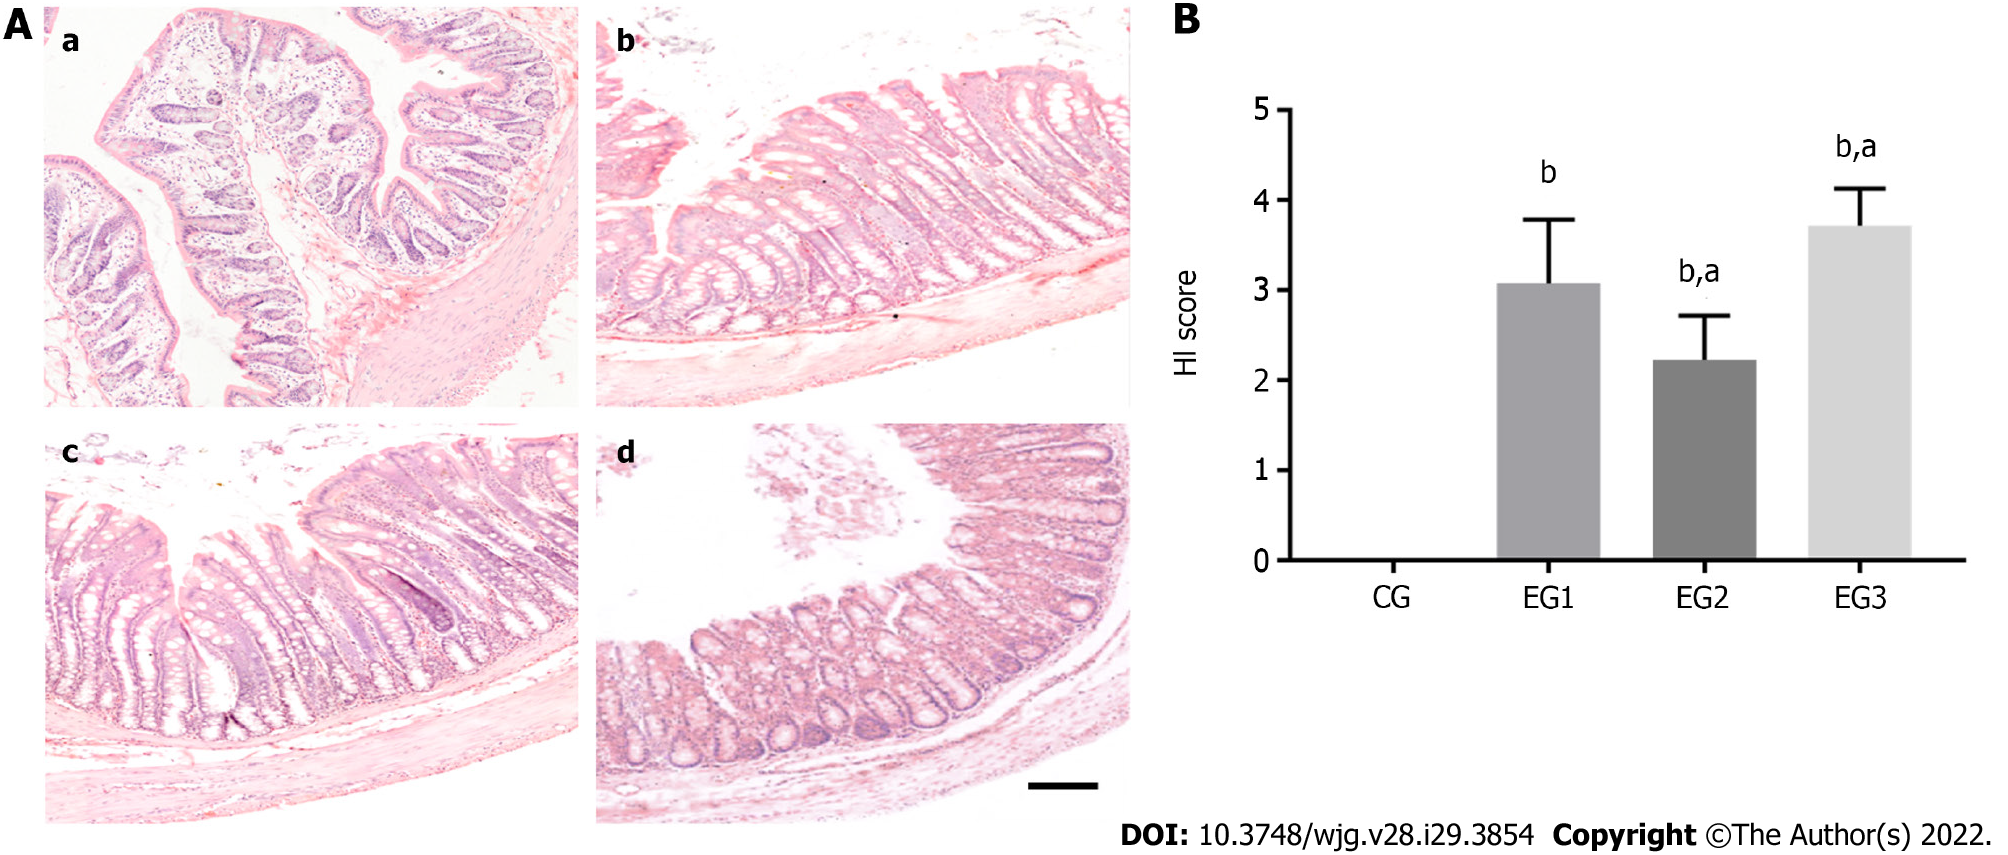
Figure 3 Histological evaluation.
A: HE stained rat colon tissues. a: CG; b: EG1; c: EG2; d: EG3. Scale bar = 100 μm; B: Comparison of colonic histological index scores showing statistically significant differences between EG groups and CG group (bP < 0.0001) and between EG2-3 groups and EG1 group (aP < 0.05). CG: Control group; UC: Ulcerative colitis; NOS: Nitric oxide synthase; L-NMMA: NG-monomethyl-L-arginine monoacetate; EG1: UC group; EG2: UC + NOS agonist TP508TFA group; EG3: UC + NOS inhibitor L-NMMA group; HI: Histological index.
- Citation: Li YR, Li Y, Jin Y, Xu M, Fan HW, Zhang Q, Tan GH, Chen J, Li YQ. Involvement of nitrergic neurons in colonic motility in a rat model of ulcerative colitis. World J Gastroenterol 2022; 28(29): 3854-3868
- URL: https://www.wjgnet.com/1007-9327/full/v28/i29/3854.htm
- DOI: https://dx.doi.org/10.3748/wjg.v28.i29.3854


