Copyright
©The Author(s) 2022.
World J Gastroenterol. Jul 28, 2022; 28(28): 3666-3681
Published online Jul 28, 2022. doi: 10.3748/wjg.v28.i28.3666
Published online Jul 28, 2022. doi: 10.3748/wjg.v28.i28.3666
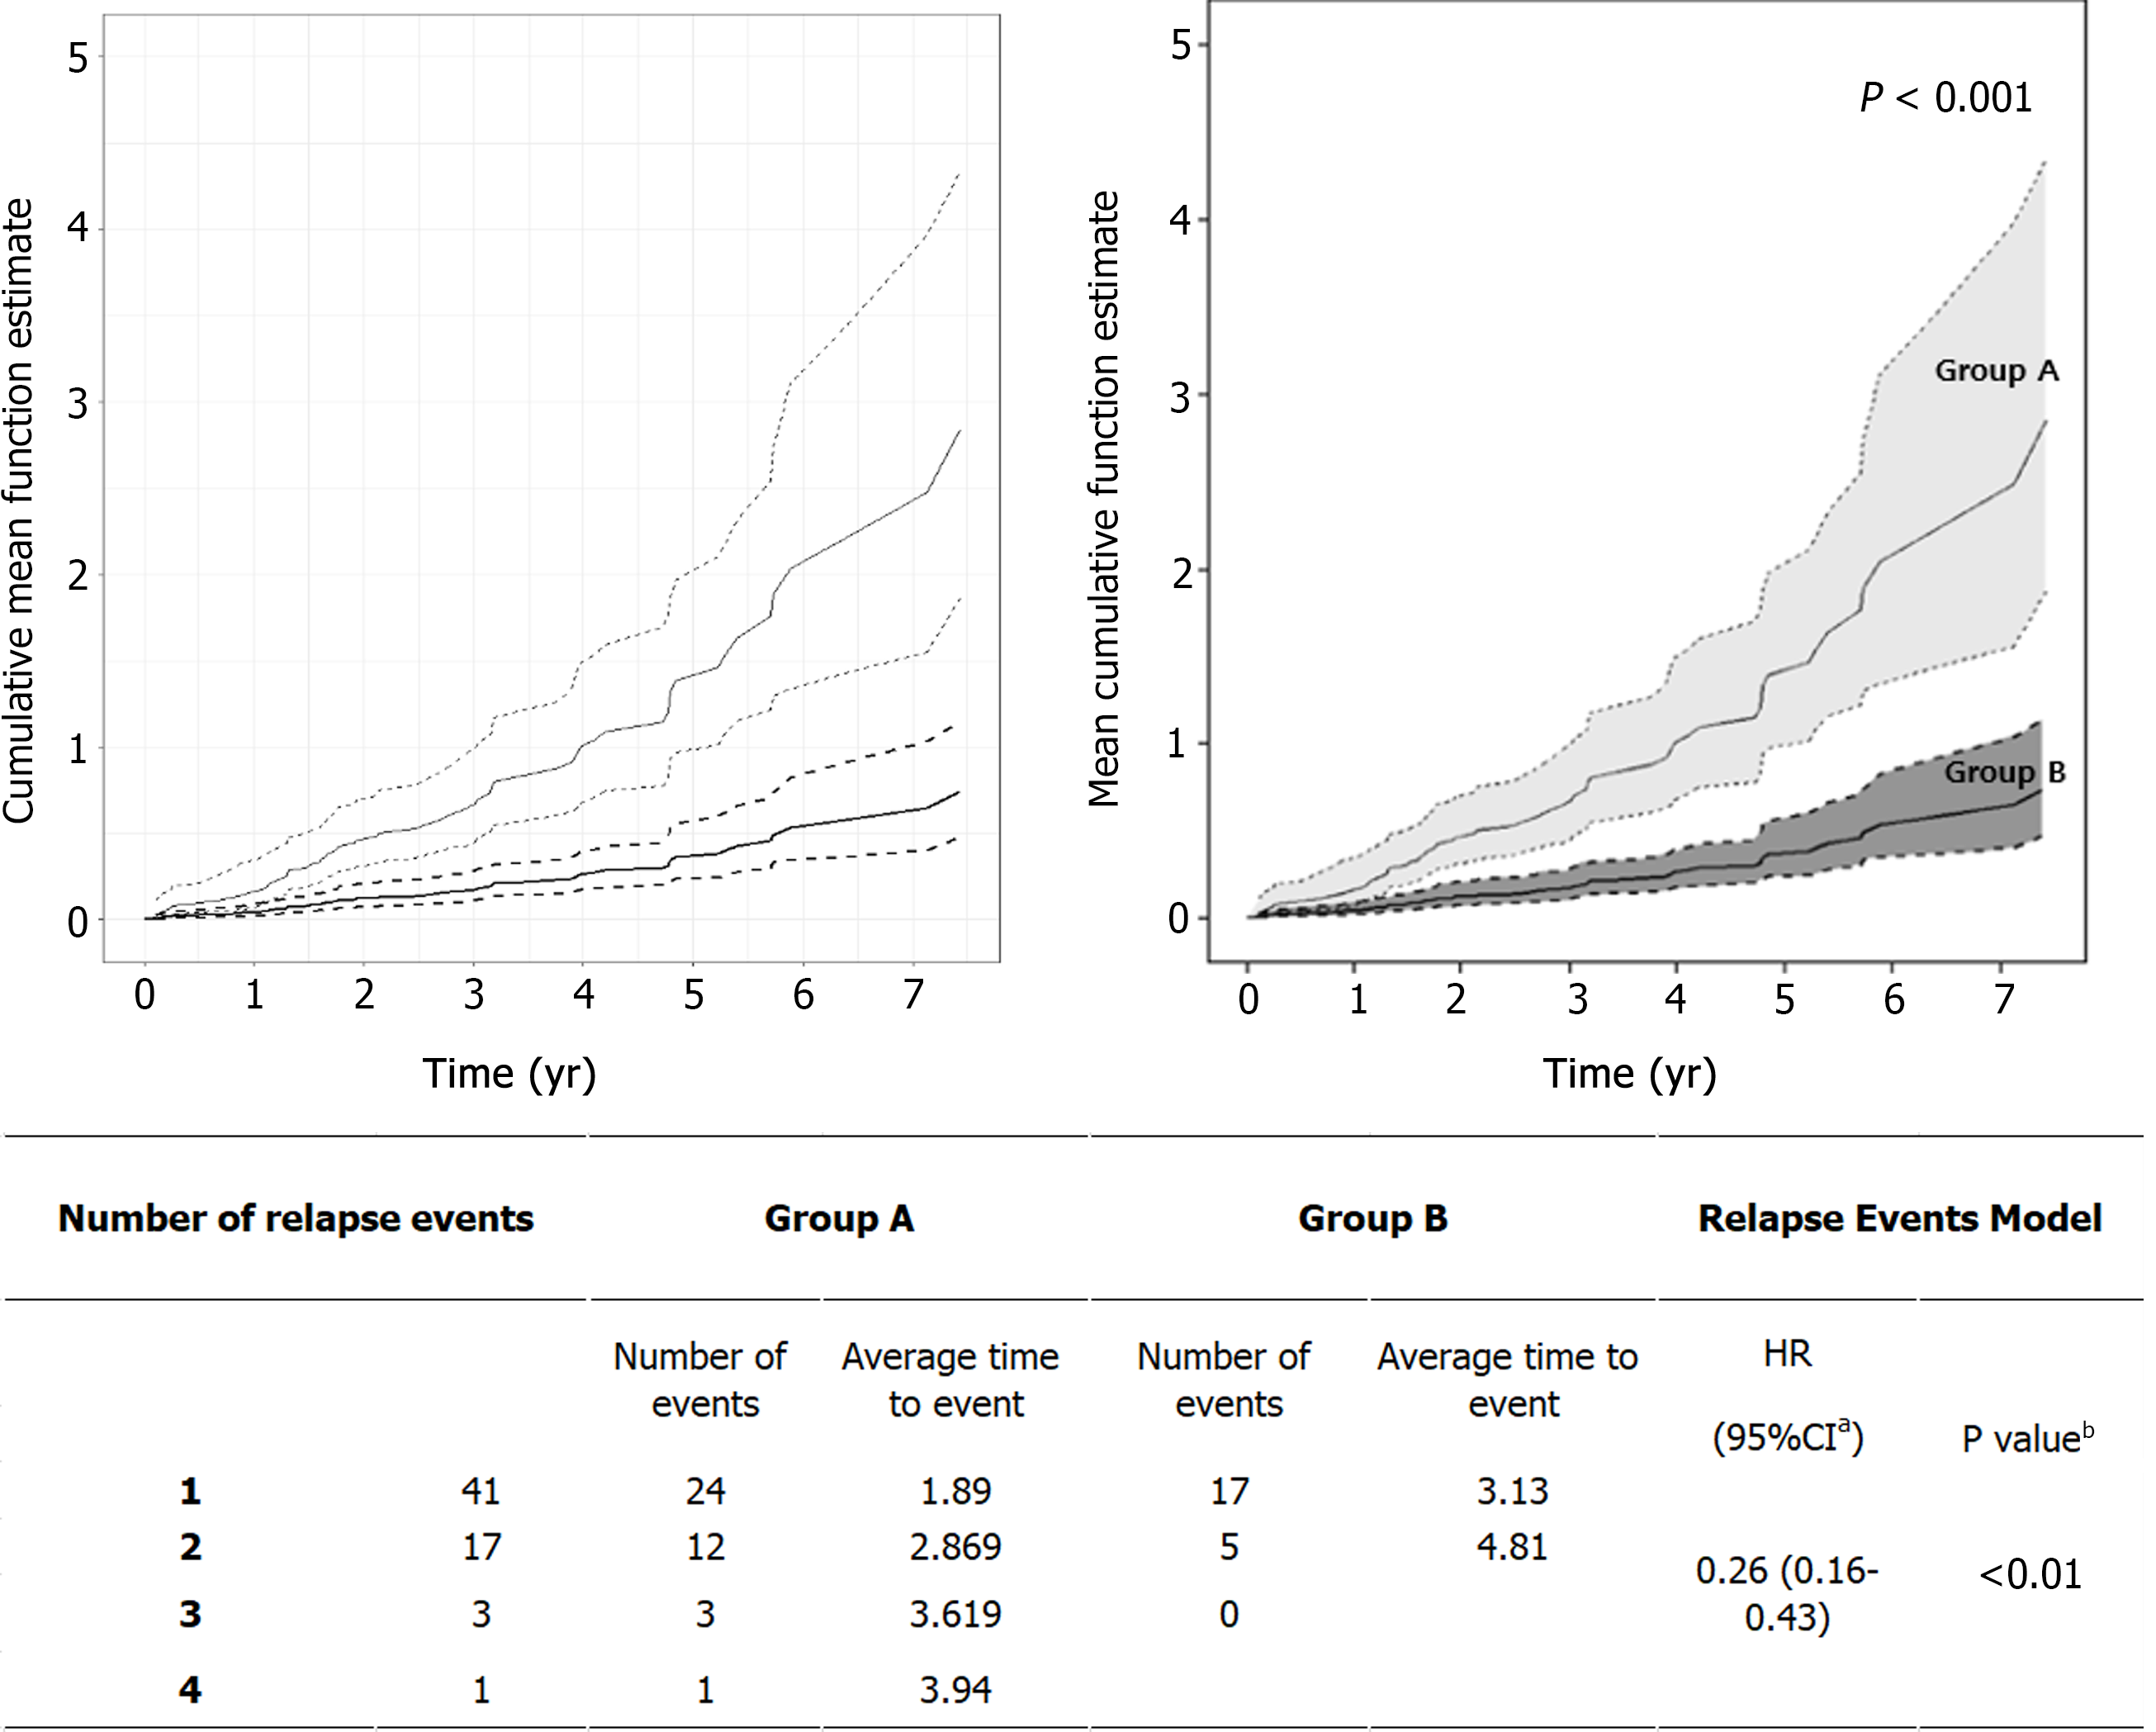
Figure 2 Mean cumulative function for multiple relapses over time.
The Y-axis is a cumulative relapse rate, which represents the cumulative hazard rate up to a specific point in time. The dotted line represents the 95% confidence interval for the cumulative risk rate. Group A: Thin black line; Group B: Thick black line.
- Citation: Kwon Y, Kim ES, Choe YH, Kim MJ. How has the disease course of pediatric ulcerative colitis changed throughout the biologics era? A comparison with the IBSEN study. World J Gastroenterol 2022; 28(28): 3666-3681
- URL: https://www.wjgnet.com/1007-9327/full/v28/i28/3666.htm
- DOI: https://dx.doi.org/10.3748/wjg.v28.i28.3666


