Copyright
©The Author(s) 2022.
World J Gastroenterol. Jul 28, 2022; 28(28): 3644-3665
Published online Jul 28, 2022. doi: 10.3748/wjg.v28.i28.3644
Published online Jul 28, 2022. doi: 10.3748/wjg.v28.i28.3644
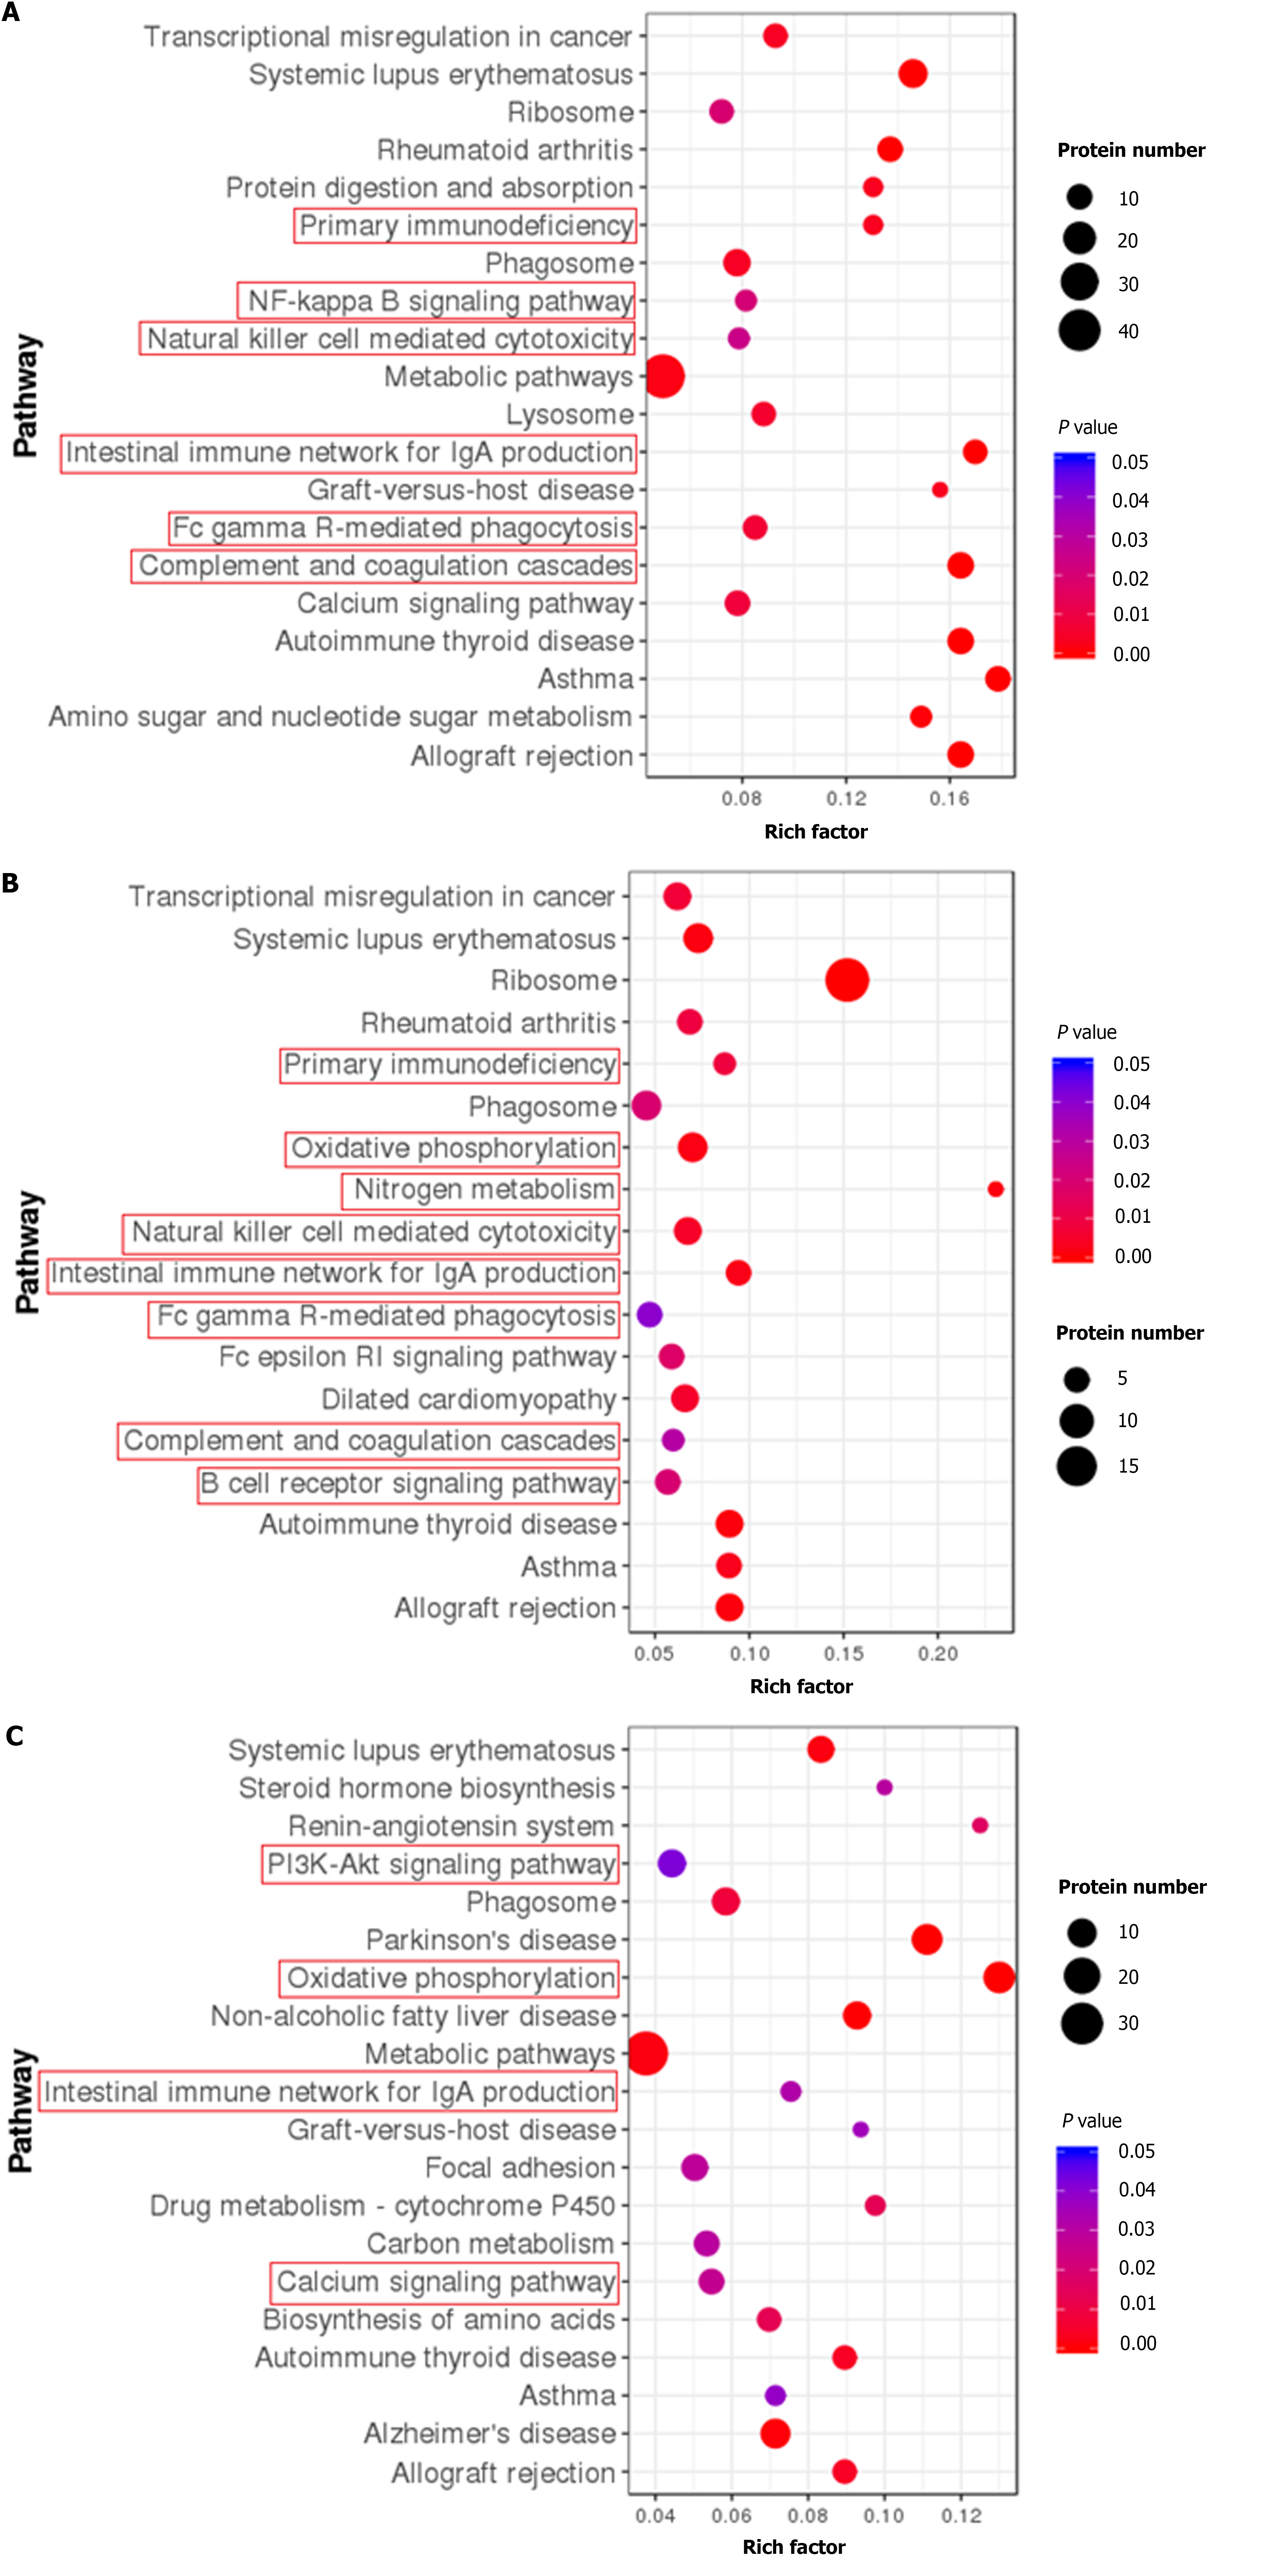
Figure 7 Kyoto Encyclopedia of Genes and Genomes pathway enrichment of differentially expressed proteins between groups.
A: Kyoto Encyclopedia of Genes and Genomes (KEGG) pathway enrichment of differentially expressed proteins (DEPs) between the normal and dextran sulfate sodium-induced ulcerative colitis model group; B: KEGG pathway enrichment of DEPs between the dextran sulfate sodium-induced ulcerative colitis model and herb-partitioned moxibustion group; C: KEGG pathway enrichment of DEPs between the dextran sulfate sodium-induced ulcerative colitis model and electroacupuncture group. Each point in the KEGG pathway enrichment plot represents a KEGG pathway, with the left axis showing the pathway name and the abscissa showing the enrichment factor, which represents the ratio of the number of DEPs annotated to that pathway to the number of proteins annotated to that pathway for that species’ protein. A larger enrichment factor indicates more reliable enrichment of DEPs in the pathway.
- Citation: Qi Q, Zhong R, Liu YN, Zhao C, Huang Y, Lu Y, Ma Z, Zheng HD, Wu LY. Mechanism of electroacupuncture and herb-partitioned moxibustion on ulcerative colitis animal model: A study based on proteomics. World J Gastroenterol 2022; 28(28): 3644-3665
- URL: https://www.wjgnet.com/1007-9327/full/v28/i28/3644.htm
- DOI: https://dx.doi.org/10.3748/wjg.v28.i28.3644


