Copyright
©The Author(s) 2022.
World J Gastroenterol. Jul 21, 2022; 28(27): 3488-3502
Published online Jul 21, 2022. doi: 10.3748/wjg.v28.i27.3488
Published online Jul 21, 2022. doi: 10.3748/wjg.v28.i27.3488
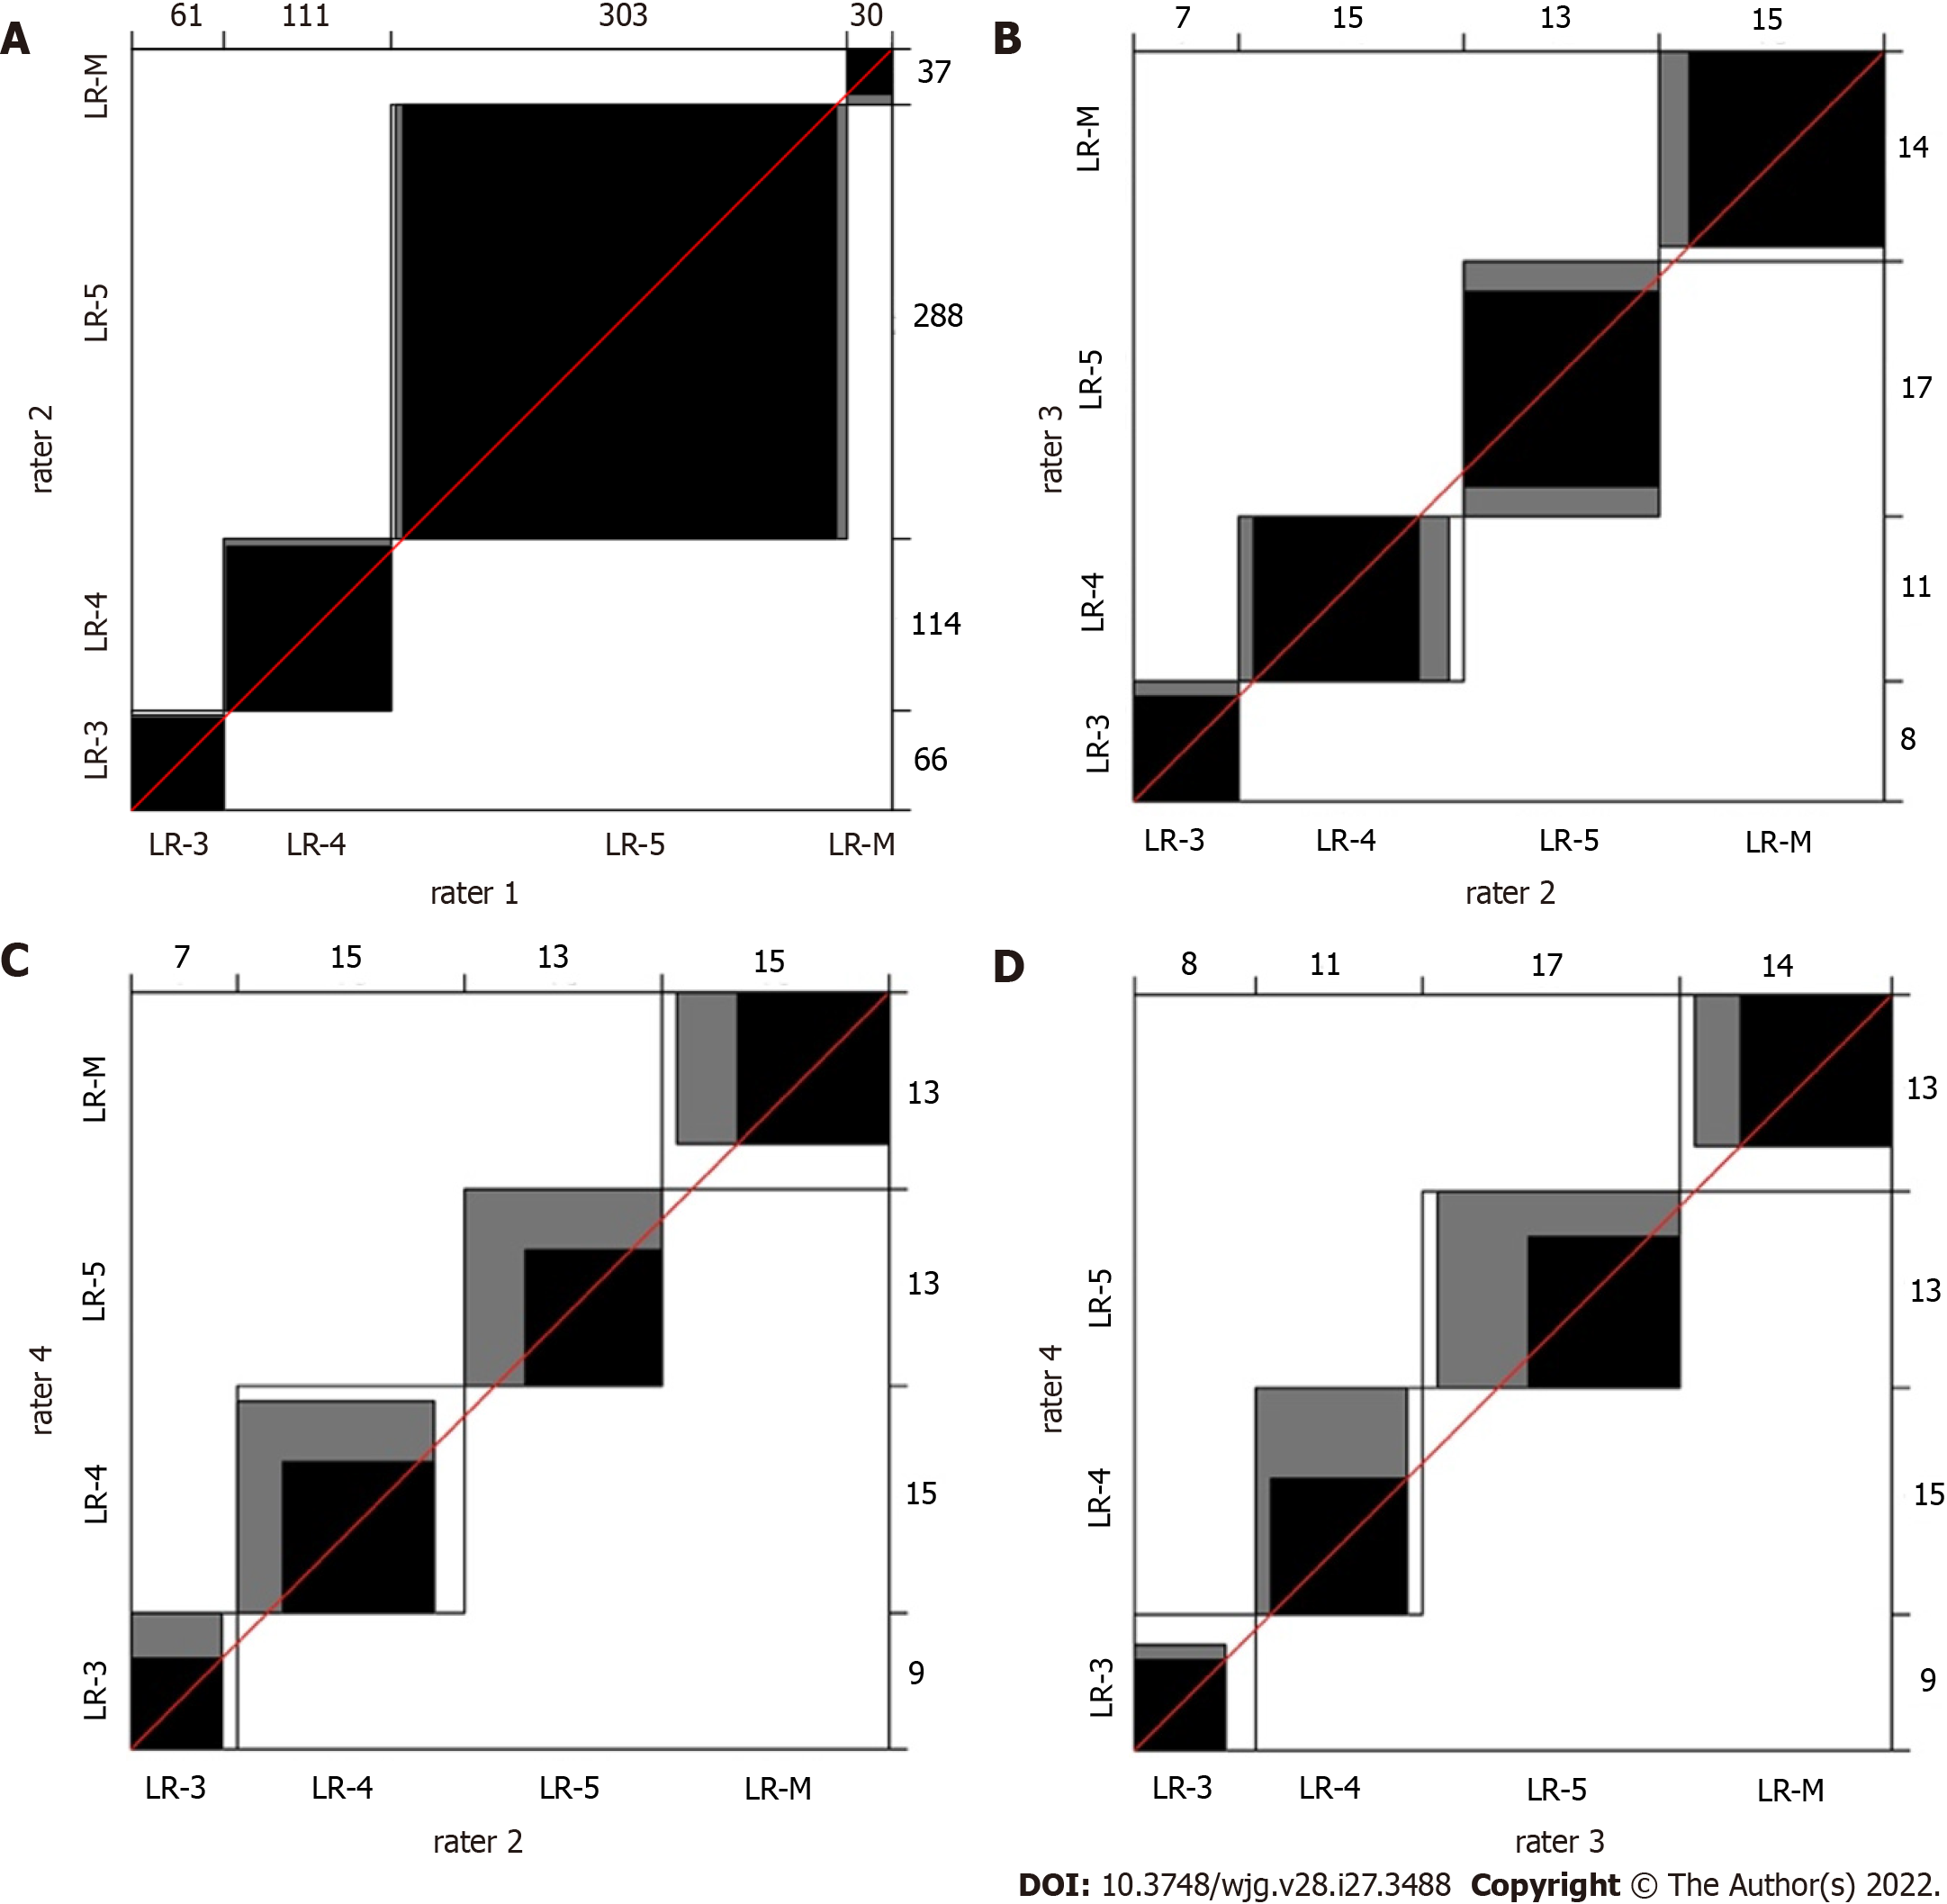
Figure 4 Bangdiwala’s agreement charts of the Contrast-enhanced ultrasound Liver Imaging Reporting and Data System class assignments between different raters.
In the case of perfect agreement, the k rectangles are represented by perfect squares and the shaded squares determined by the diagonal cell entries are exactly equal to the rectangles; lesser agreement is visualized by comparing the area of the blackened squares to the area of the rectangles. A: Agreement chart between the two internal raters (1 and 2), with the exclusion of LR-1 and LR-2 classes due to their rarity (n = 505); B-D: Agreement charts among the three raters from different centres (2, 3, and 4) for the subgroup of 50 nodules. We list the agreement charts between raters 2 and 3 (B), between raters 2 and 4 (C), and between raters 3 and 4 (D).
- Citation: Vidili G, Arru M, Solinas G, Calvisi DF, Meloni P, Sauchella A, Turilli D, Fabio C, Cossu A, Madeddu G, Babudieri S, Zocco MA, Iannetti G, Di Lembo E, Delitala AP, Manetti R. Contrast-enhanced ultrasound Liver Imaging Reporting and Data System: Lights and shadows in hepatocellular carcinoma and cholangiocellular carcinoma diagnosis. World J Gastroenterol 2022; 28(27): 3488-3502
- URL: https://www.wjgnet.com/1007-9327/full/v28/i27/3488.htm
- DOI: https://dx.doi.org/10.3748/wjg.v28.i27.3488


