Copyright
©The Author(s) 2022.
World J Gastroenterol. Jul 21, 2022; 28(27): 3455-3475
Published online Jul 21, 2022. doi: 10.3748/wjg.v28.i27.3455
Published online Jul 21, 2022. doi: 10.3748/wjg.v28.i27.3455
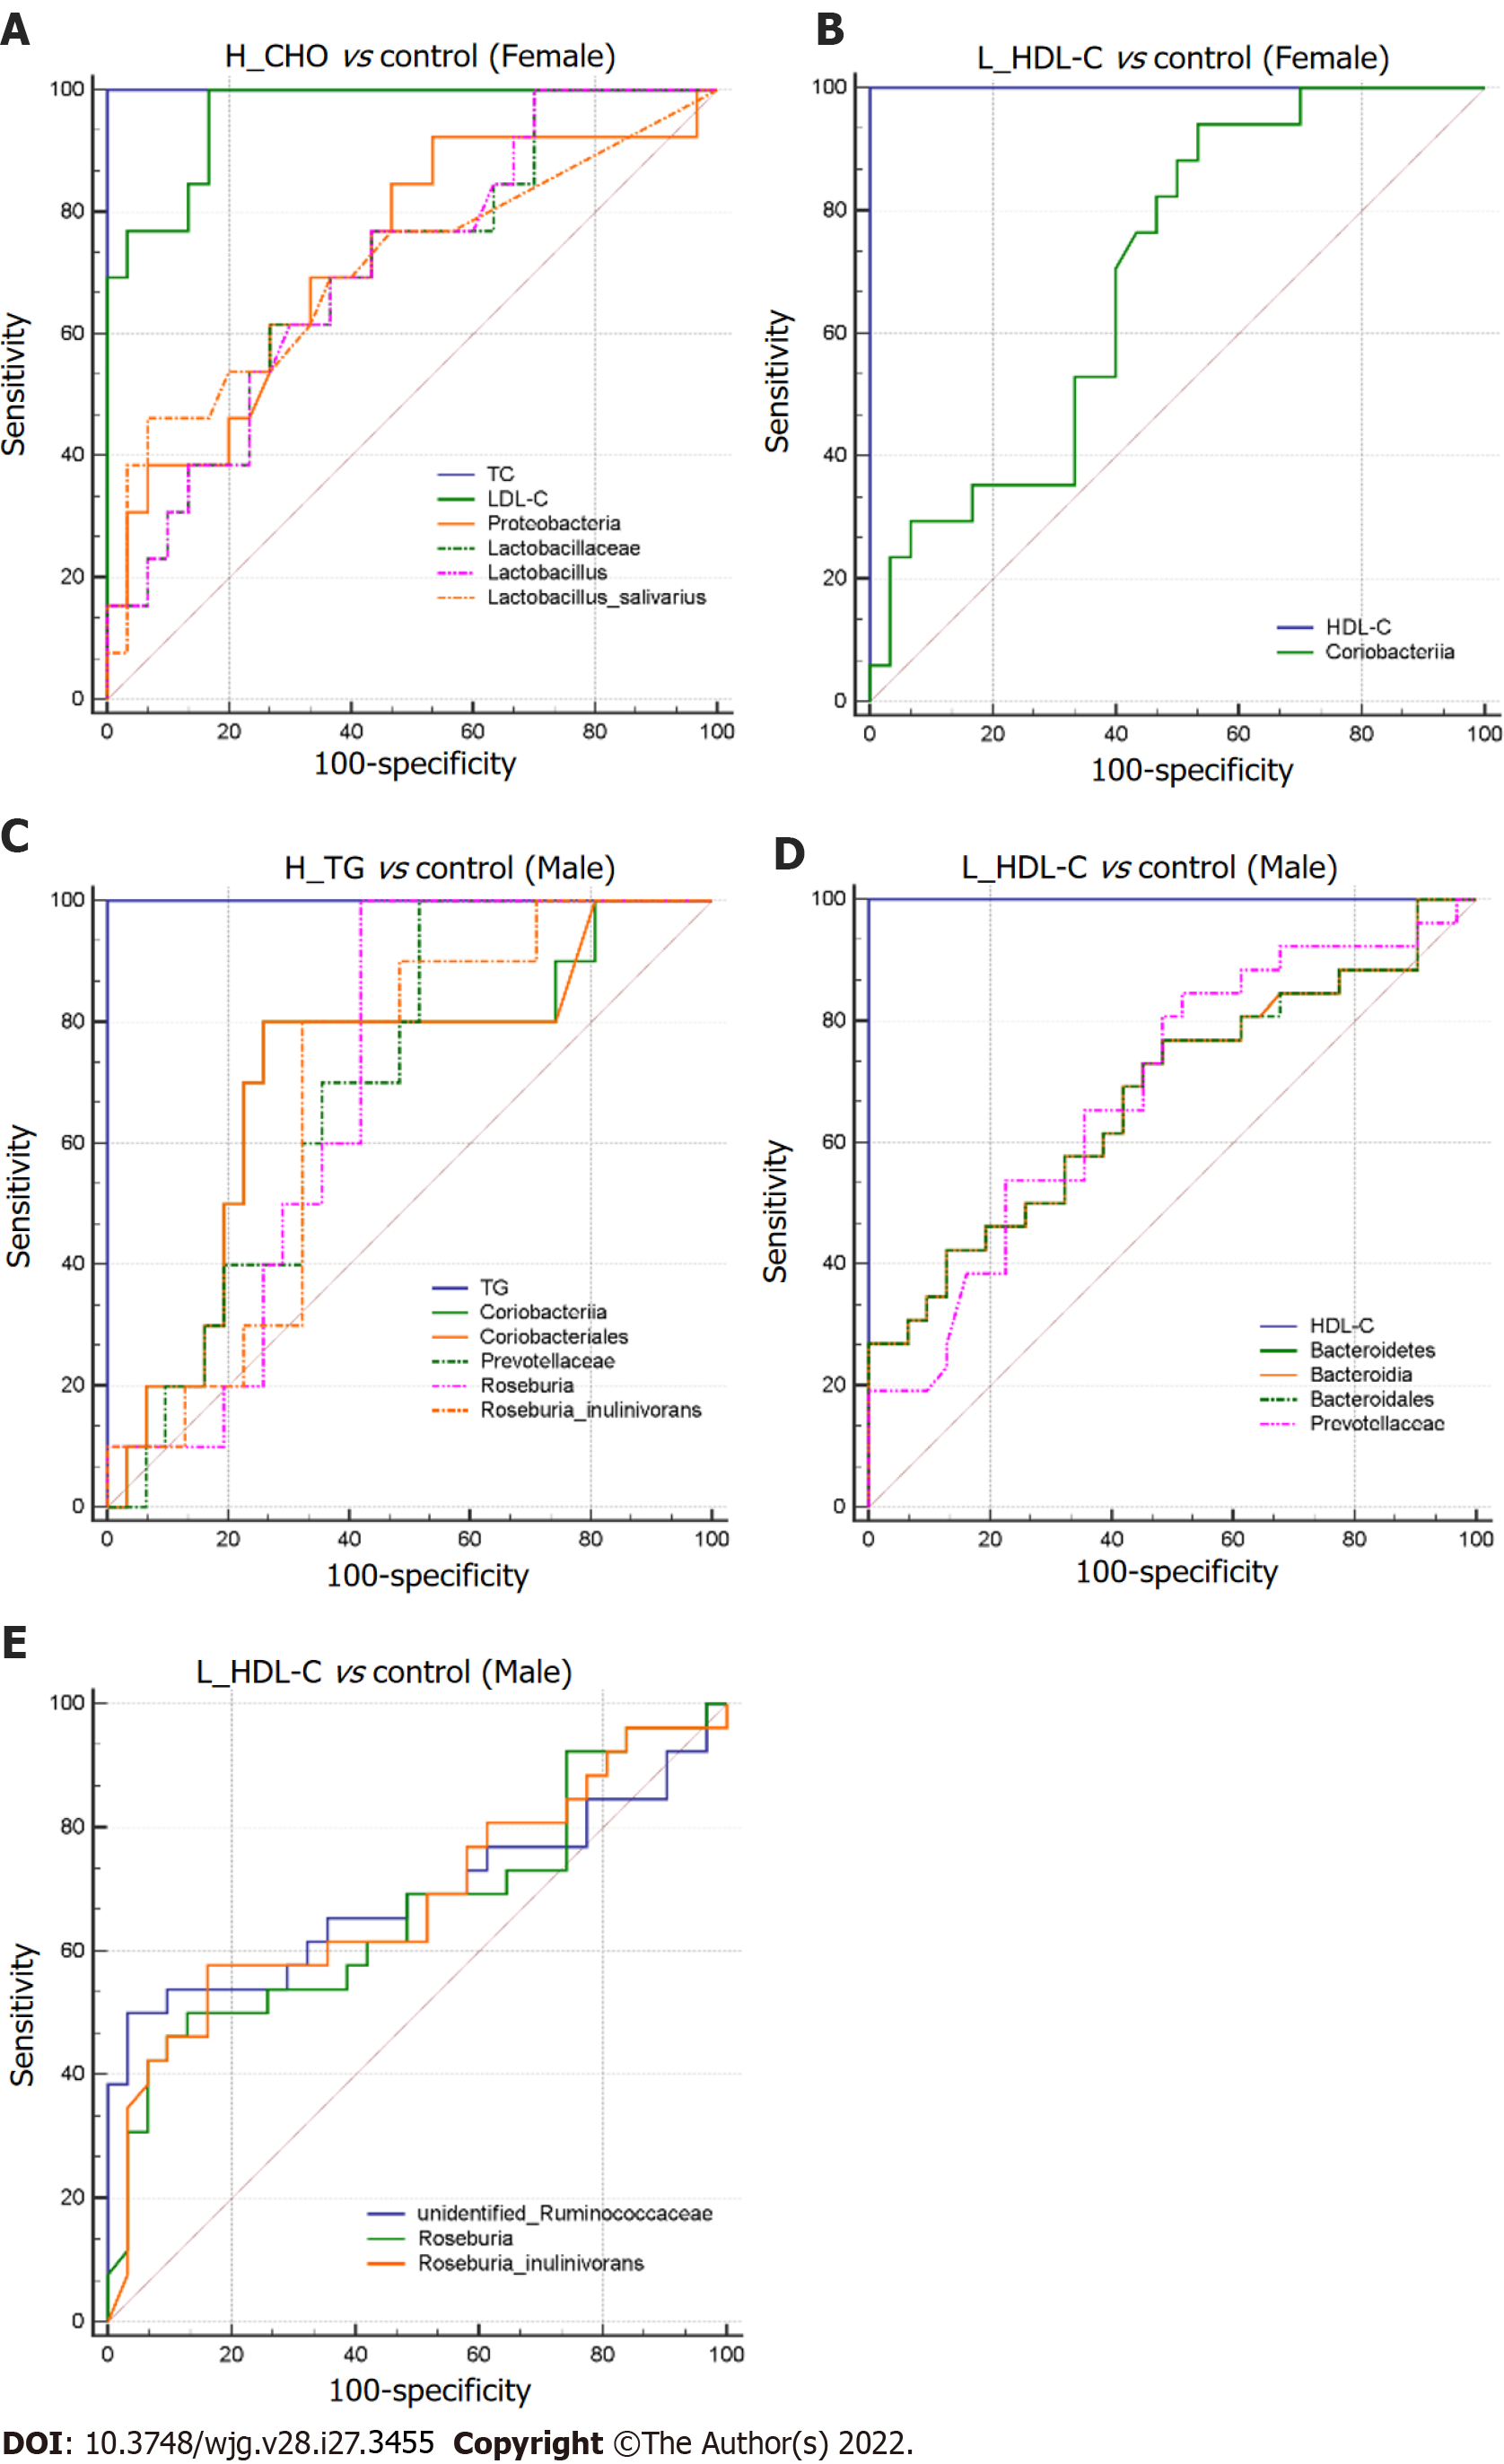
Figure 9 Differential gut microbiota taxa-based classification of dyslipidemia in the study population.
Receiver operating characteristic curve analysis for identifying dyslipidemia subgroup from controls by gut microbiota taxa in females and males. A: High total cholesterol vs control (Female); B: Low high-density lipoprotein cholesterol (L_HDL-C) vs control (Female); C: High triglyceride vs control (Male); D and E: L_HDL-C vs control (Male). H_CHO: High total cholesterol; H_TG: high triglyceride; L_HDL-C: Low high-density lipoprotein cholesterol.
- Citation: Guo L, Wang YY, Wang JH, Zhao HP, Yu Y, Wang GD, Dai K, Yan YZ, Yang YJ, Lv J. Associations of gut microbiota with dyslipidemia based on sex differences in subjects from Northwestern China. World J Gastroenterol 2022; 28(27): 3455-3475
- URL: https://www.wjgnet.com/1007-9327/full/v28/i27/3455.htm
- DOI: https://dx.doi.org/10.3748/wjg.v28.i27.3455


