Copyright
©The Author(s) 2022.
World J Gastroenterol. Jul 21, 2022; 28(27): 3455-3475
Published online Jul 21, 2022. doi: 10.3748/wjg.v28.i27.3455
Published online Jul 21, 2022. doi: 10.3748/wjg.v28.i27.3455
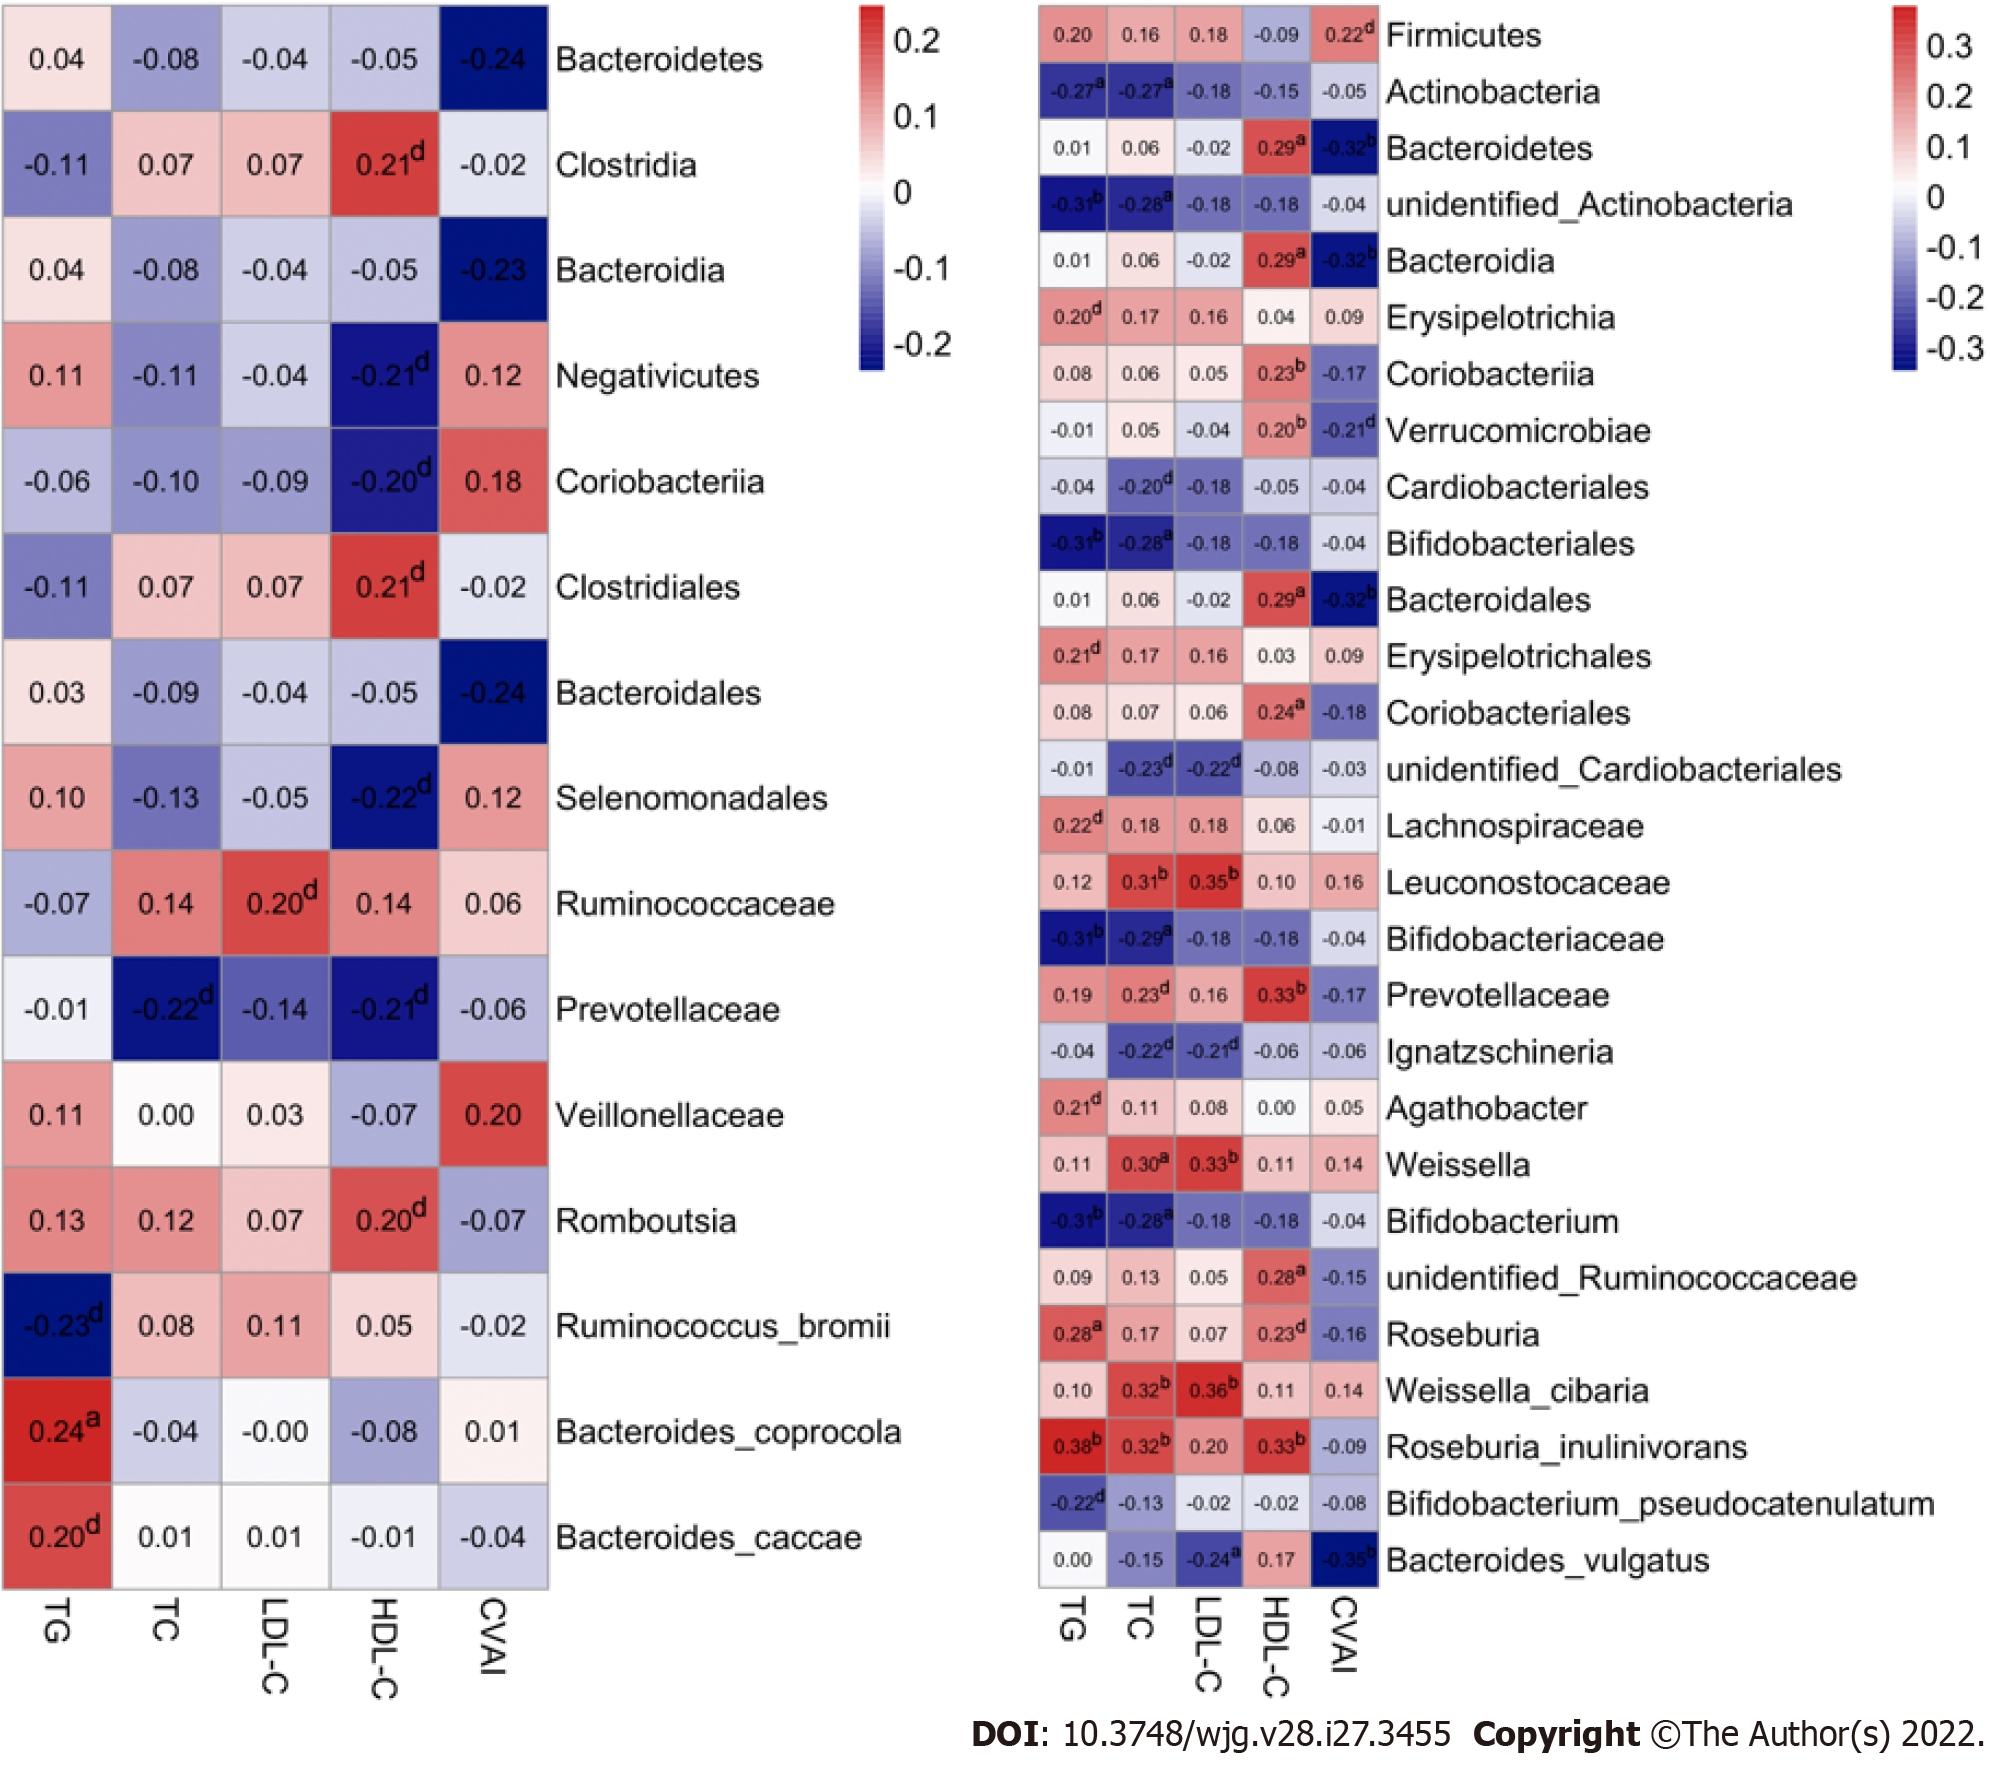
Figure 8 Associations of gut microbiota taxa with serum lipid indicators in the study population.
A: Correlations of gut microbiota (GM) taxa with serum lipid indicators in females. Spearman’s correlation analysis was conducted. The number presented in each cell is the correlation coefficient. The larger the absolute value is, the stronger the correlation is. Blue indicates a negative correlation and red indicates a positive correlation. The depth of the color represents the strength of the correlation. The deeper the color is, the stronger the correlation is; B: Correlations of GM taxa with serum lipid indicators in males. aP < 0.05, bP < 0.01, dP < 0.1. TG: Triglyceride; TC: Total cholesterol; LDL-C: Low-density lipoprotein cholesterol; HDL-C: High-density lipoprotein cholesterol; CVAI: Chinese visceral adiposity index.
- Citation: Guo L, Wang YY, Wang JH, Zhao HP, Yu Y, Wang GD, Dai K, Yan YZ, Yang YJ, Lv J. Associations of gut microbiota with dyslipidemia based on sex differences in subjects from Northwestern China. World J Gastroenterol 2022; 28(27): 3455-3475
- URL: https://www.wjgnet.com/1007-9327/full/v28/i27/3455.htm
- DOI: https://dx.doi.org/10.3748/wjg.v28.i27.3455


