Copyright
©The Author(s) 2022.
World J Gastroenterol. Jul 21, 2022; 28(27): 3455-3475
Published online Jul 21, 2022. doi: 10.3748/wjg.v28.i27.3455
Published online Jul 21, 2022. doi: 10.3748/wjg.v28.i27.3455
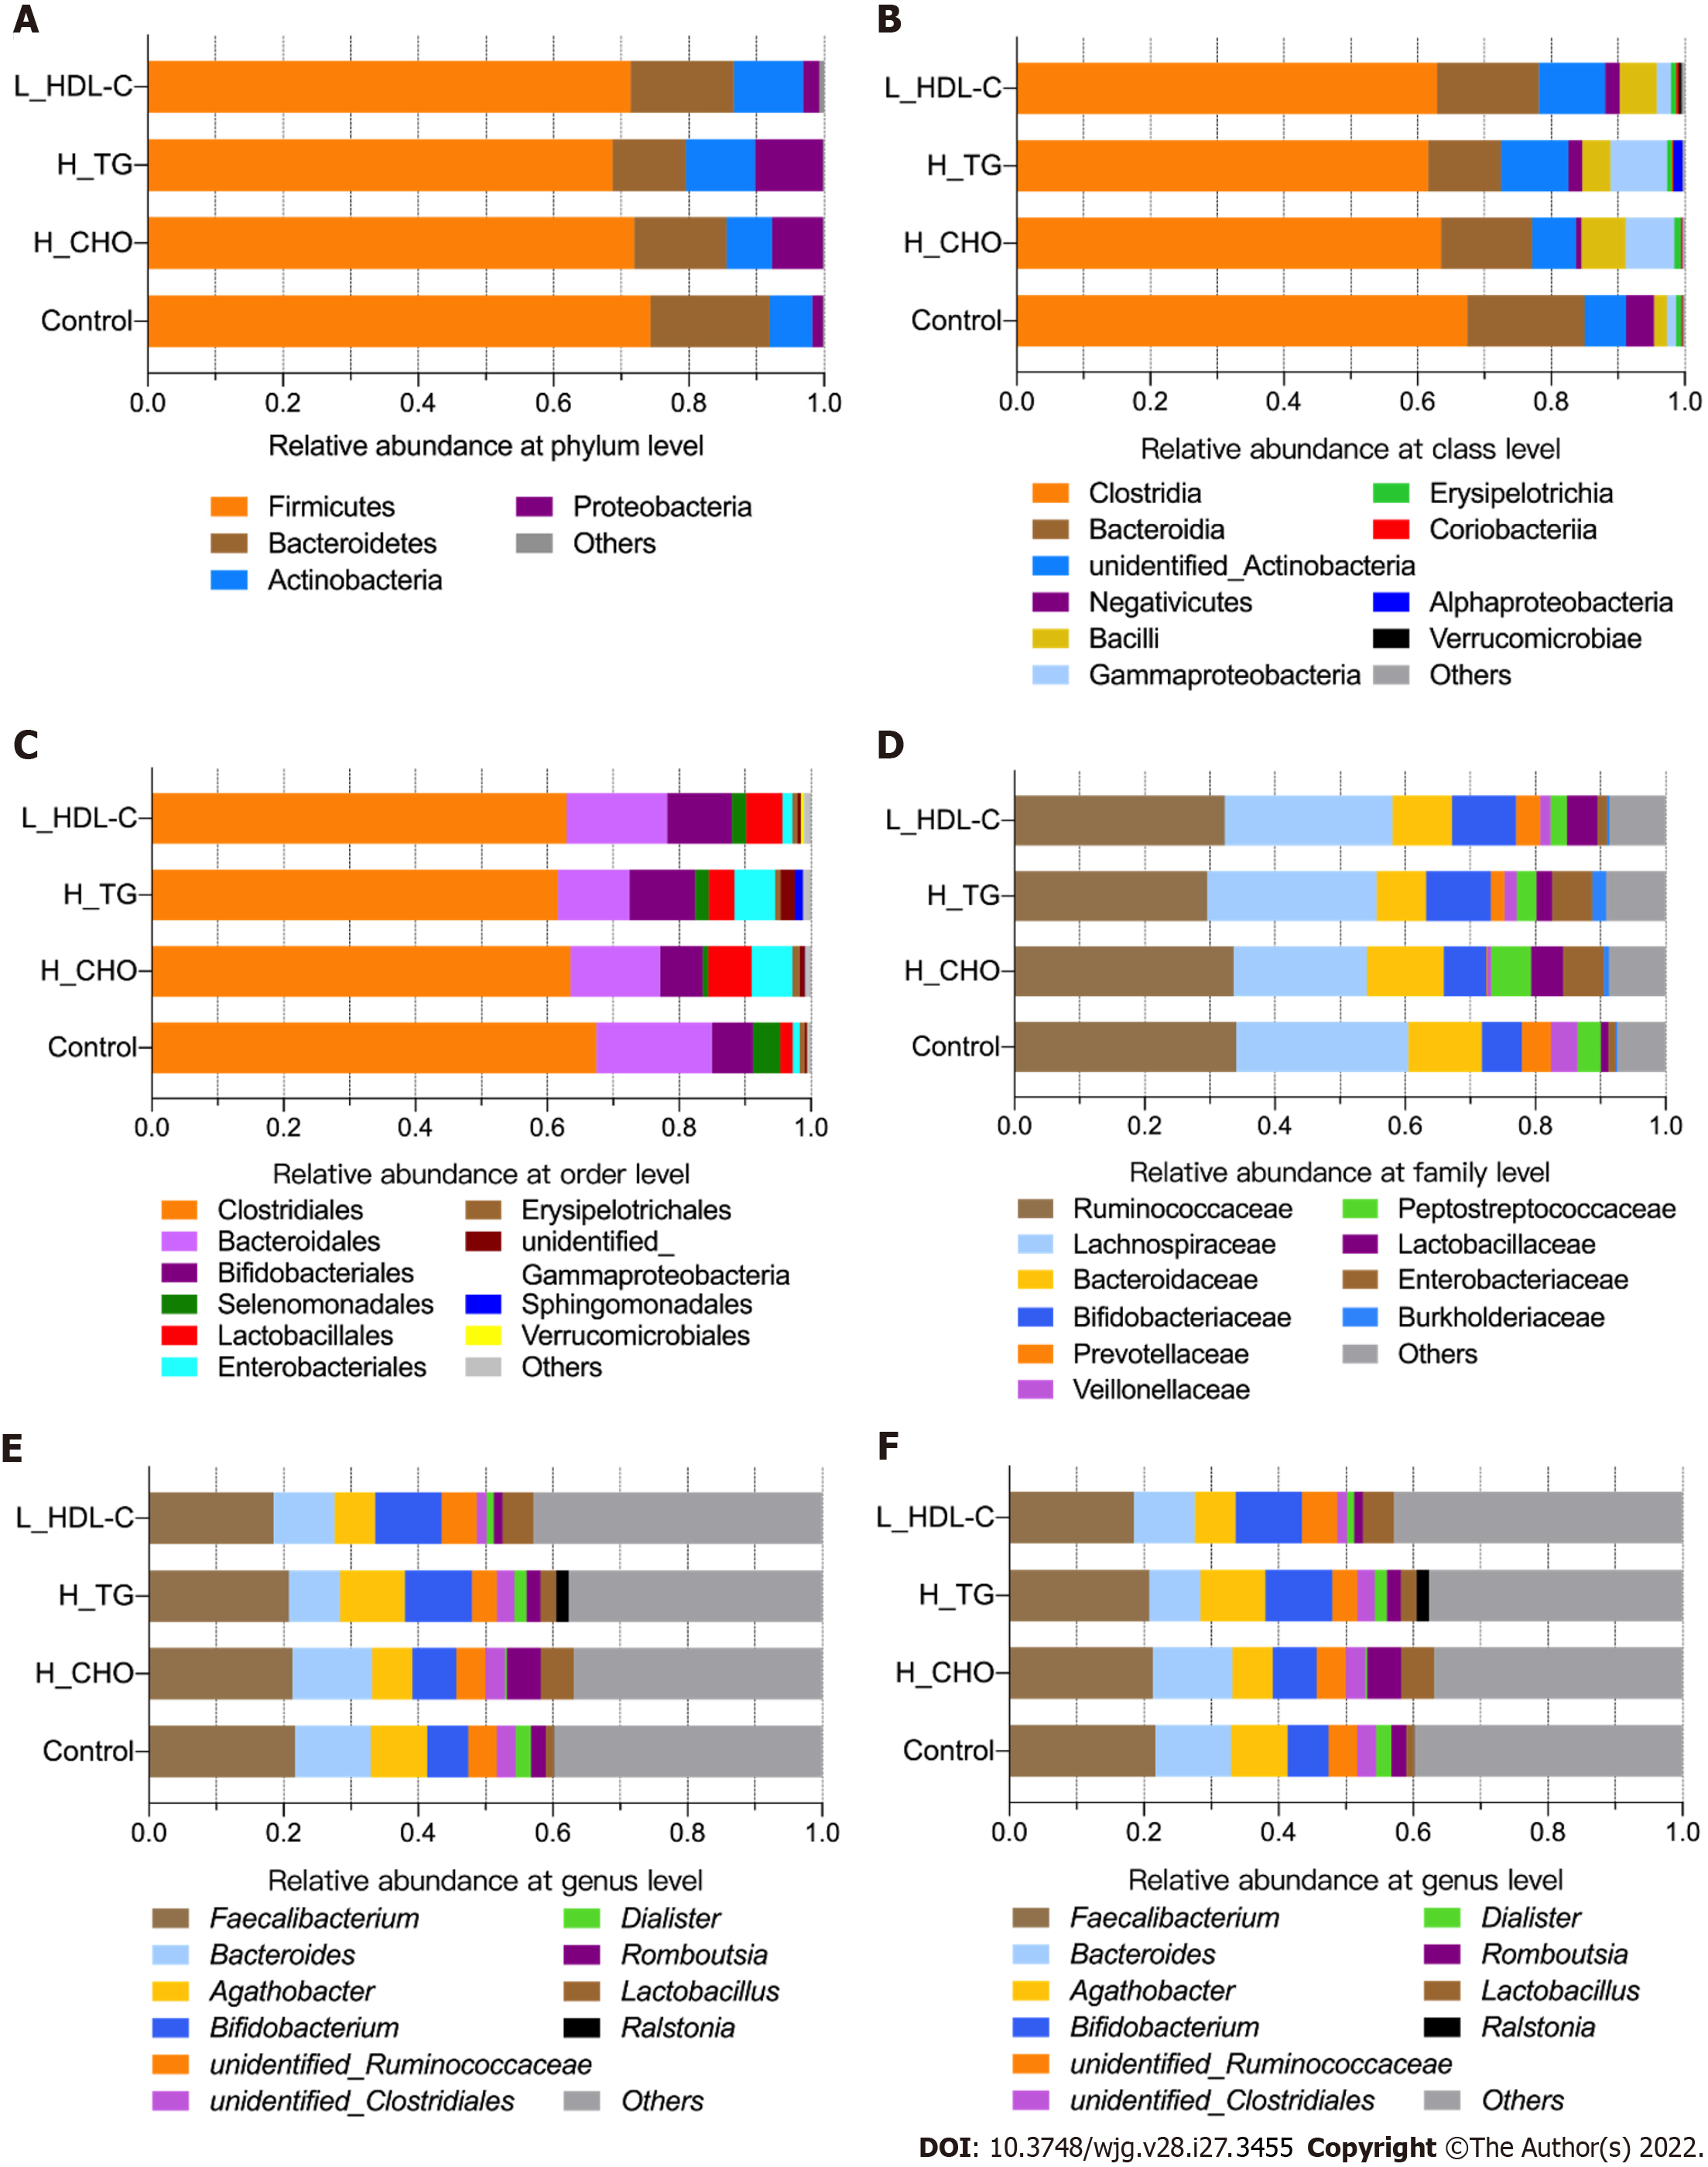
Figure 4 The taxonomic composition of gut microbiota in females of the study population.
Bar plots show the relative abundances of the top ten taxa at the six taxonomic levels, including phyla, class, orders, family, genus and species, in females. Each component of the cumulative bar chart indicates a phylum, a class, an order, a family, a genus or a species. A: Relative abundance at phylum level; B: Relative abundance at class level; C: Relative abundance at order level; D: Relative abundance at family level; E: Relative abundance at genus level; F: Relative abundance at species level. H_CHO: High total cholesterol; H_TG: high triglyceride; L_HDL-C: Low high-density lipoprotein cholesterol.
- Citation: Guo L, Wang YY, Wang JH, Zhao HP, Yu Y, Wang GD, Dai K, Yan YZ, Yang YJ, Lv J. Associations of gut microbiota with dyslipidemia based on sex differences in subjects from Northwestern China. World J Gastroenterol 2022; 28(27): 3455-3475
- URL: https://www.wjgnet.com/1007-9327/full/v28/i27/3455.htm
- DOI: https://dx.doi.org/10.3748/wjg.v28.i27.3455


