Copyright
©The Author(s) 2022.
World J Gastroenterol. Jul 21, 2022; 28(27): 3455-3475
Published online Jul 21, 2022. doi: 10.3748/wjg.v28.i27.3455
Published online Jul 21, 2022. doi: 10.3748/wjg.v28.i27.3455
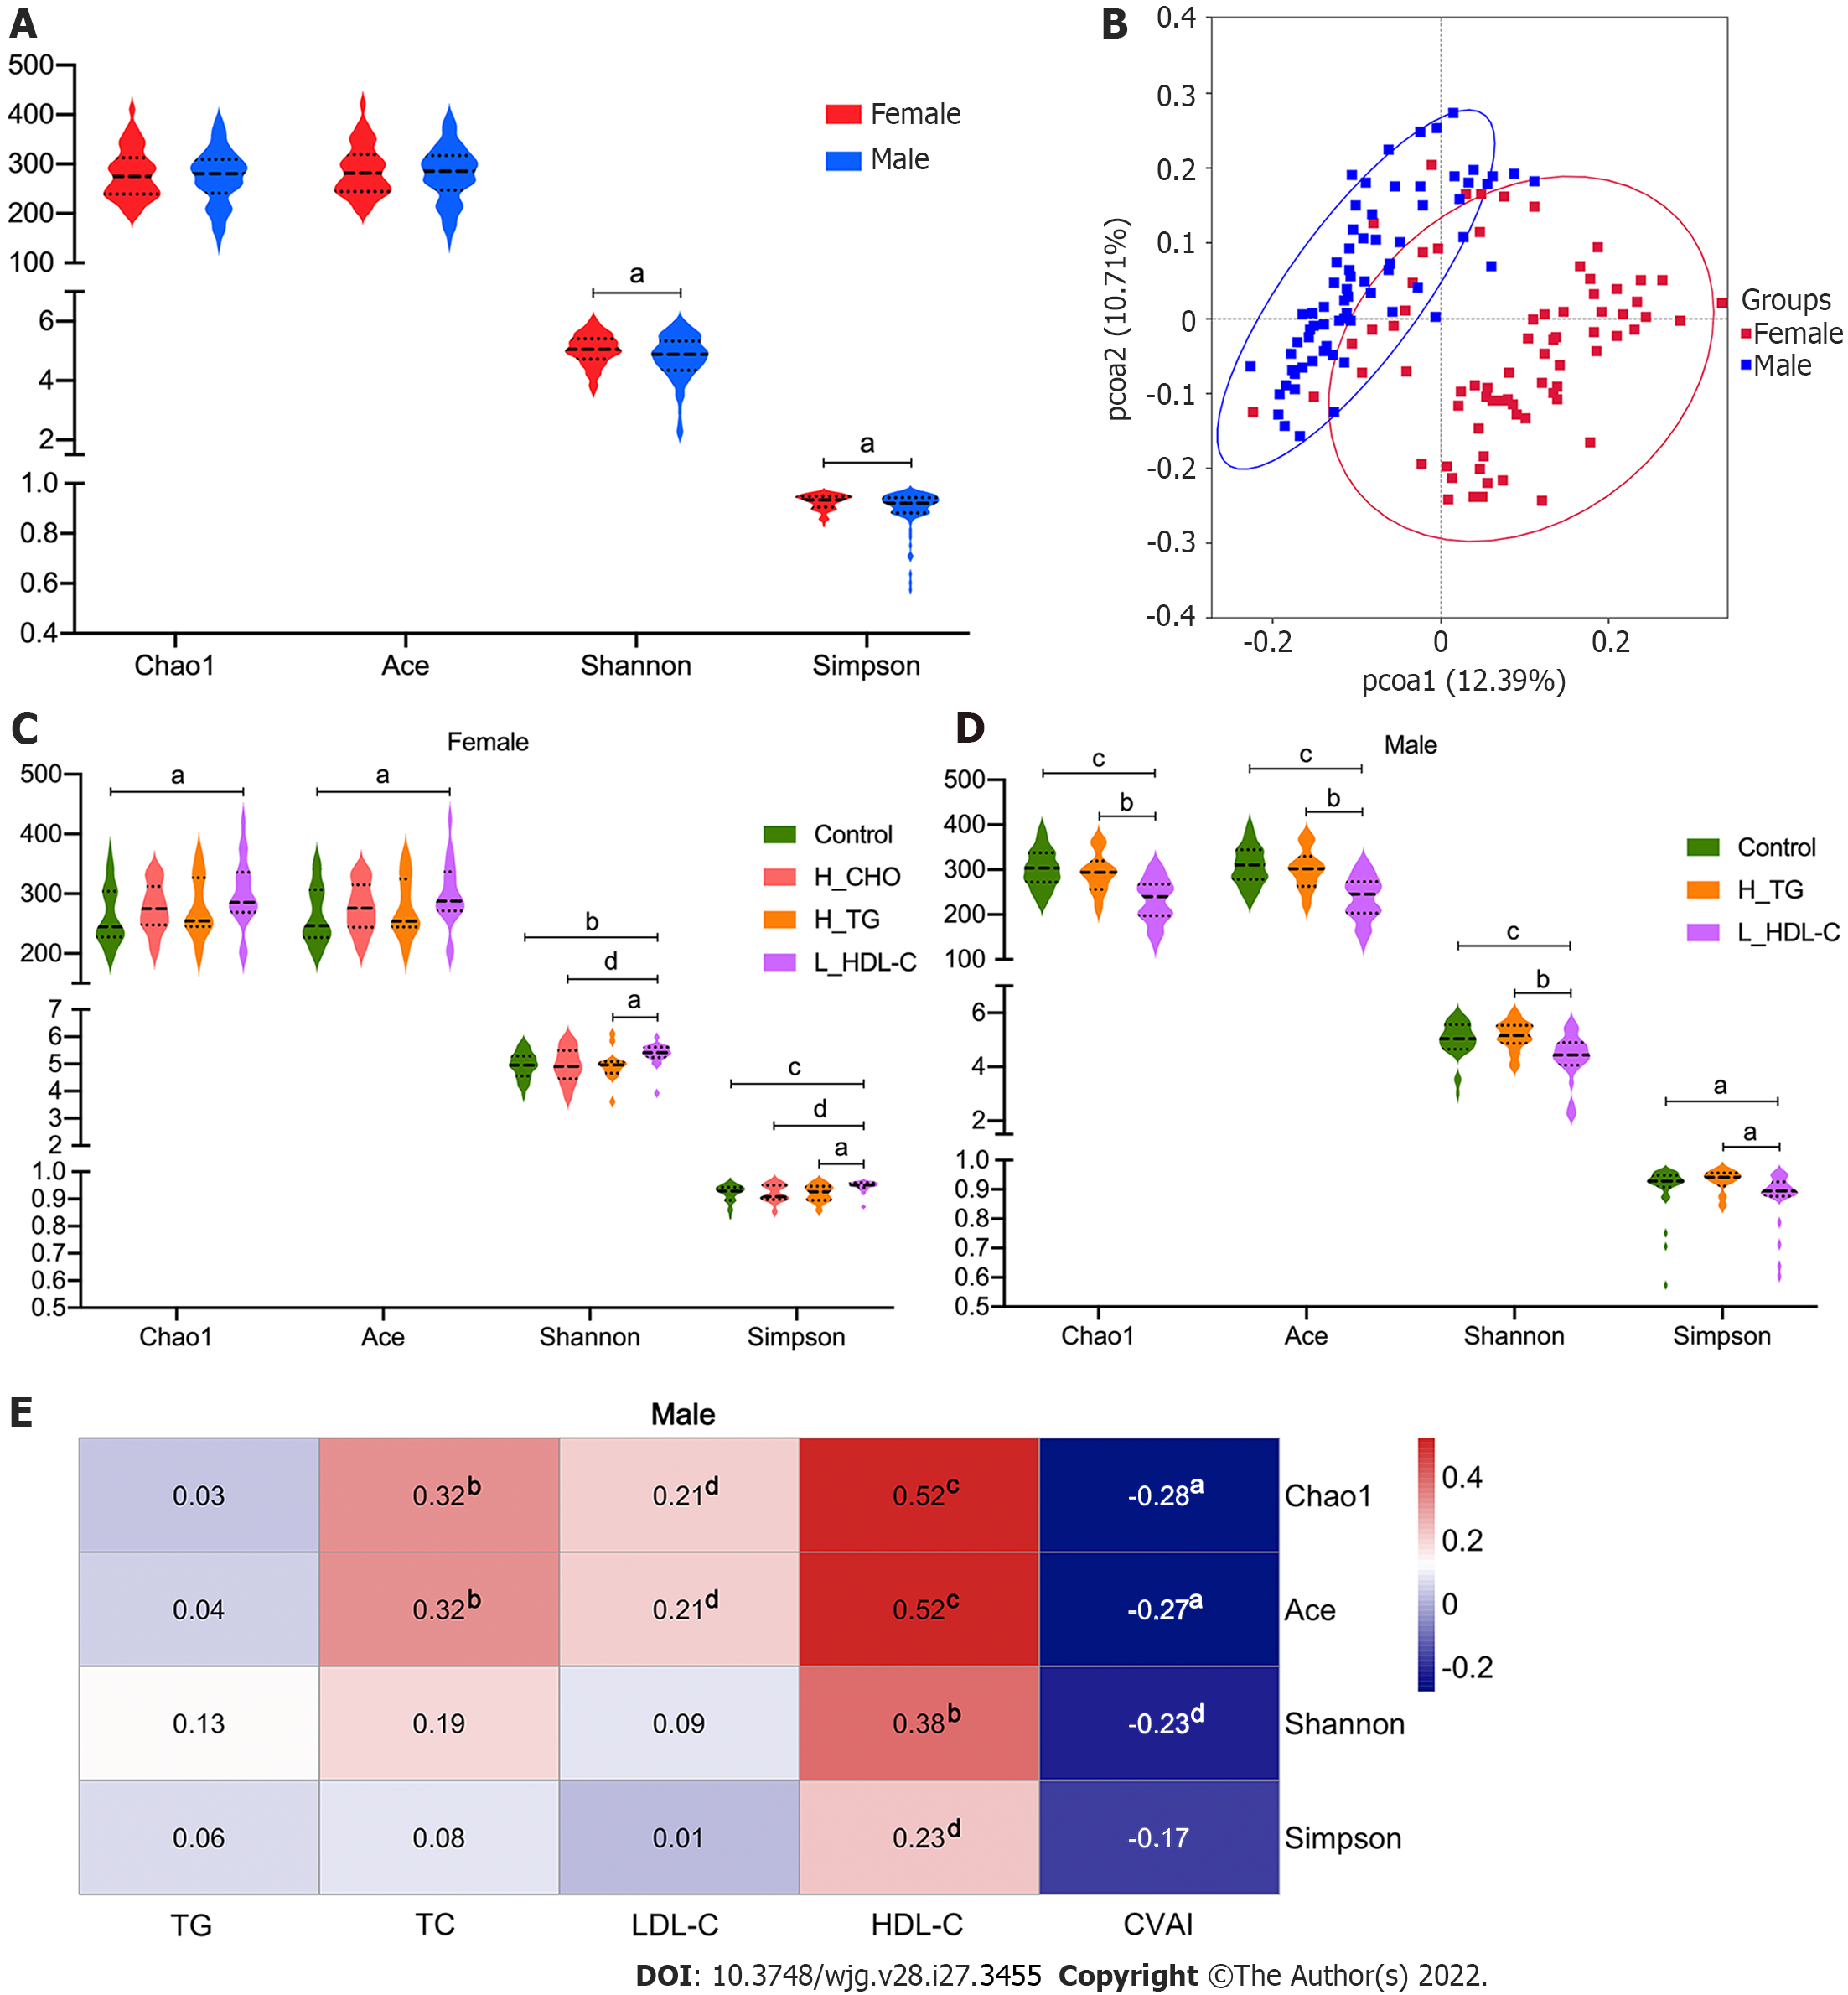
Figure 3 Diversity analysis of gut microbiota in the study population.
A: Violin plots of α-diversity analysis of gut microbiota (GM) in females and males of the study population. Each plot represents one index of the α-diversity distribution of GM, including Chao1, Ace, Shannon and Simpson indices, for each group. The Wilcoxon rank-sum test was used to evaluate the differences between groups; B: Plots of principal coordinate analysis (PCoA) based on the operational taxonomic unit level in females and males of the study population. Each square represents the GM community in one sample, and the axis title represents the percentage change of interpretation. The distance between squares represents the similarity or dissimilarity of the GM community in the study population, and PCoA analysis was conducted by unweighted UniFrac method; C: Violin plots of α-diversity analysis of GM in females of the study population; D: Violin plots of α-diversity analysis of GM in males of the study population; E: Correlations between GM diversity and serum lipid profiles in males of the study population. Spearman’s correlation analysis was conducted. The number presented in each cell is the correlation coefficient. The larger the absolute value is, the stronger the correlation is. Blue indicates a negative correlation and red indicates a positive correlation. The depth of the color represents the strength of the correlation. The deeper the color is, the stronger the correlation is. aP < 0.05, bP < 0.01, cP < 0.001, dP < 0.1. TG: Triglyceride; TC: Total cholesterol; LDL-C: Low-density lipoprotein cholesterol; HDL-C: High-density lipoprotein cholesterol; CVAI: Chinese visceral adiposity index; H_CHO: High total cholesterol; H_TG: high triglyceride; L_HDL-C: Low high-density lipoprotein cholesterol.
- Citation: Guo L, Wang YY, Wang JH, Zhao HP, Yu Y, Wang GD, Dai K, Yan YZ, Yang YJ, Lv J. Associations of gut microbiota with dyslipidemia based on sex differences in subjects from Northwestern China. World J Gastroenterol 2022; 28(27): 3455-3475
- URL: https://www.wjgnet.com/1007-9327/full/v28/i27/3455.htm
- DOI: https://dx.doi.org/10.3748/wjg.v28.i27.3455


